In this blog post, we will cover the basic usage of FireDBG VS Code Extension ("the Extension") and FireDBG CLI ("the CLI"). By the end of this tutorial, you will learn:
- How to install the Extension and the CLI
- How to setup a Rust workspace for FireDBG debugger
- How to debug Rust binary, example, unit test and integration test with FireDBG debugger
- How to interpret and inspect visualized call tree, variables and timeline in the Extension
- How to interpret and inspect breakpoint events of multi-threaded program in the Extension
- How to trace any variable / expression of interest with the
fire::dbg!trace macro - How to selectively enable / disable tracing of a local package
- How to use the CLI to operate FireDBG debugger and then interpret and inspect breakpoint events via SQLite
If you're curious about the background and inner working of FireDBG
Installation
Before we start, make sure you have VS Code and Rust installed.
- VS Code (version 1.80.0 or later)
- Rust (version 1.74.0 or later)
Rust & Cargo
# install rustup
curl --proto '=https' --tlsv1.2 -sSf https://sh.rustup.rs | sh
# install stable
rustup install stable
FireDBG VS Code Extension
The Extension provides seamless integration with FireDBG to enhance debugging experience and developer productivity.
Search and install the FireDBG extension.
Windows Notes
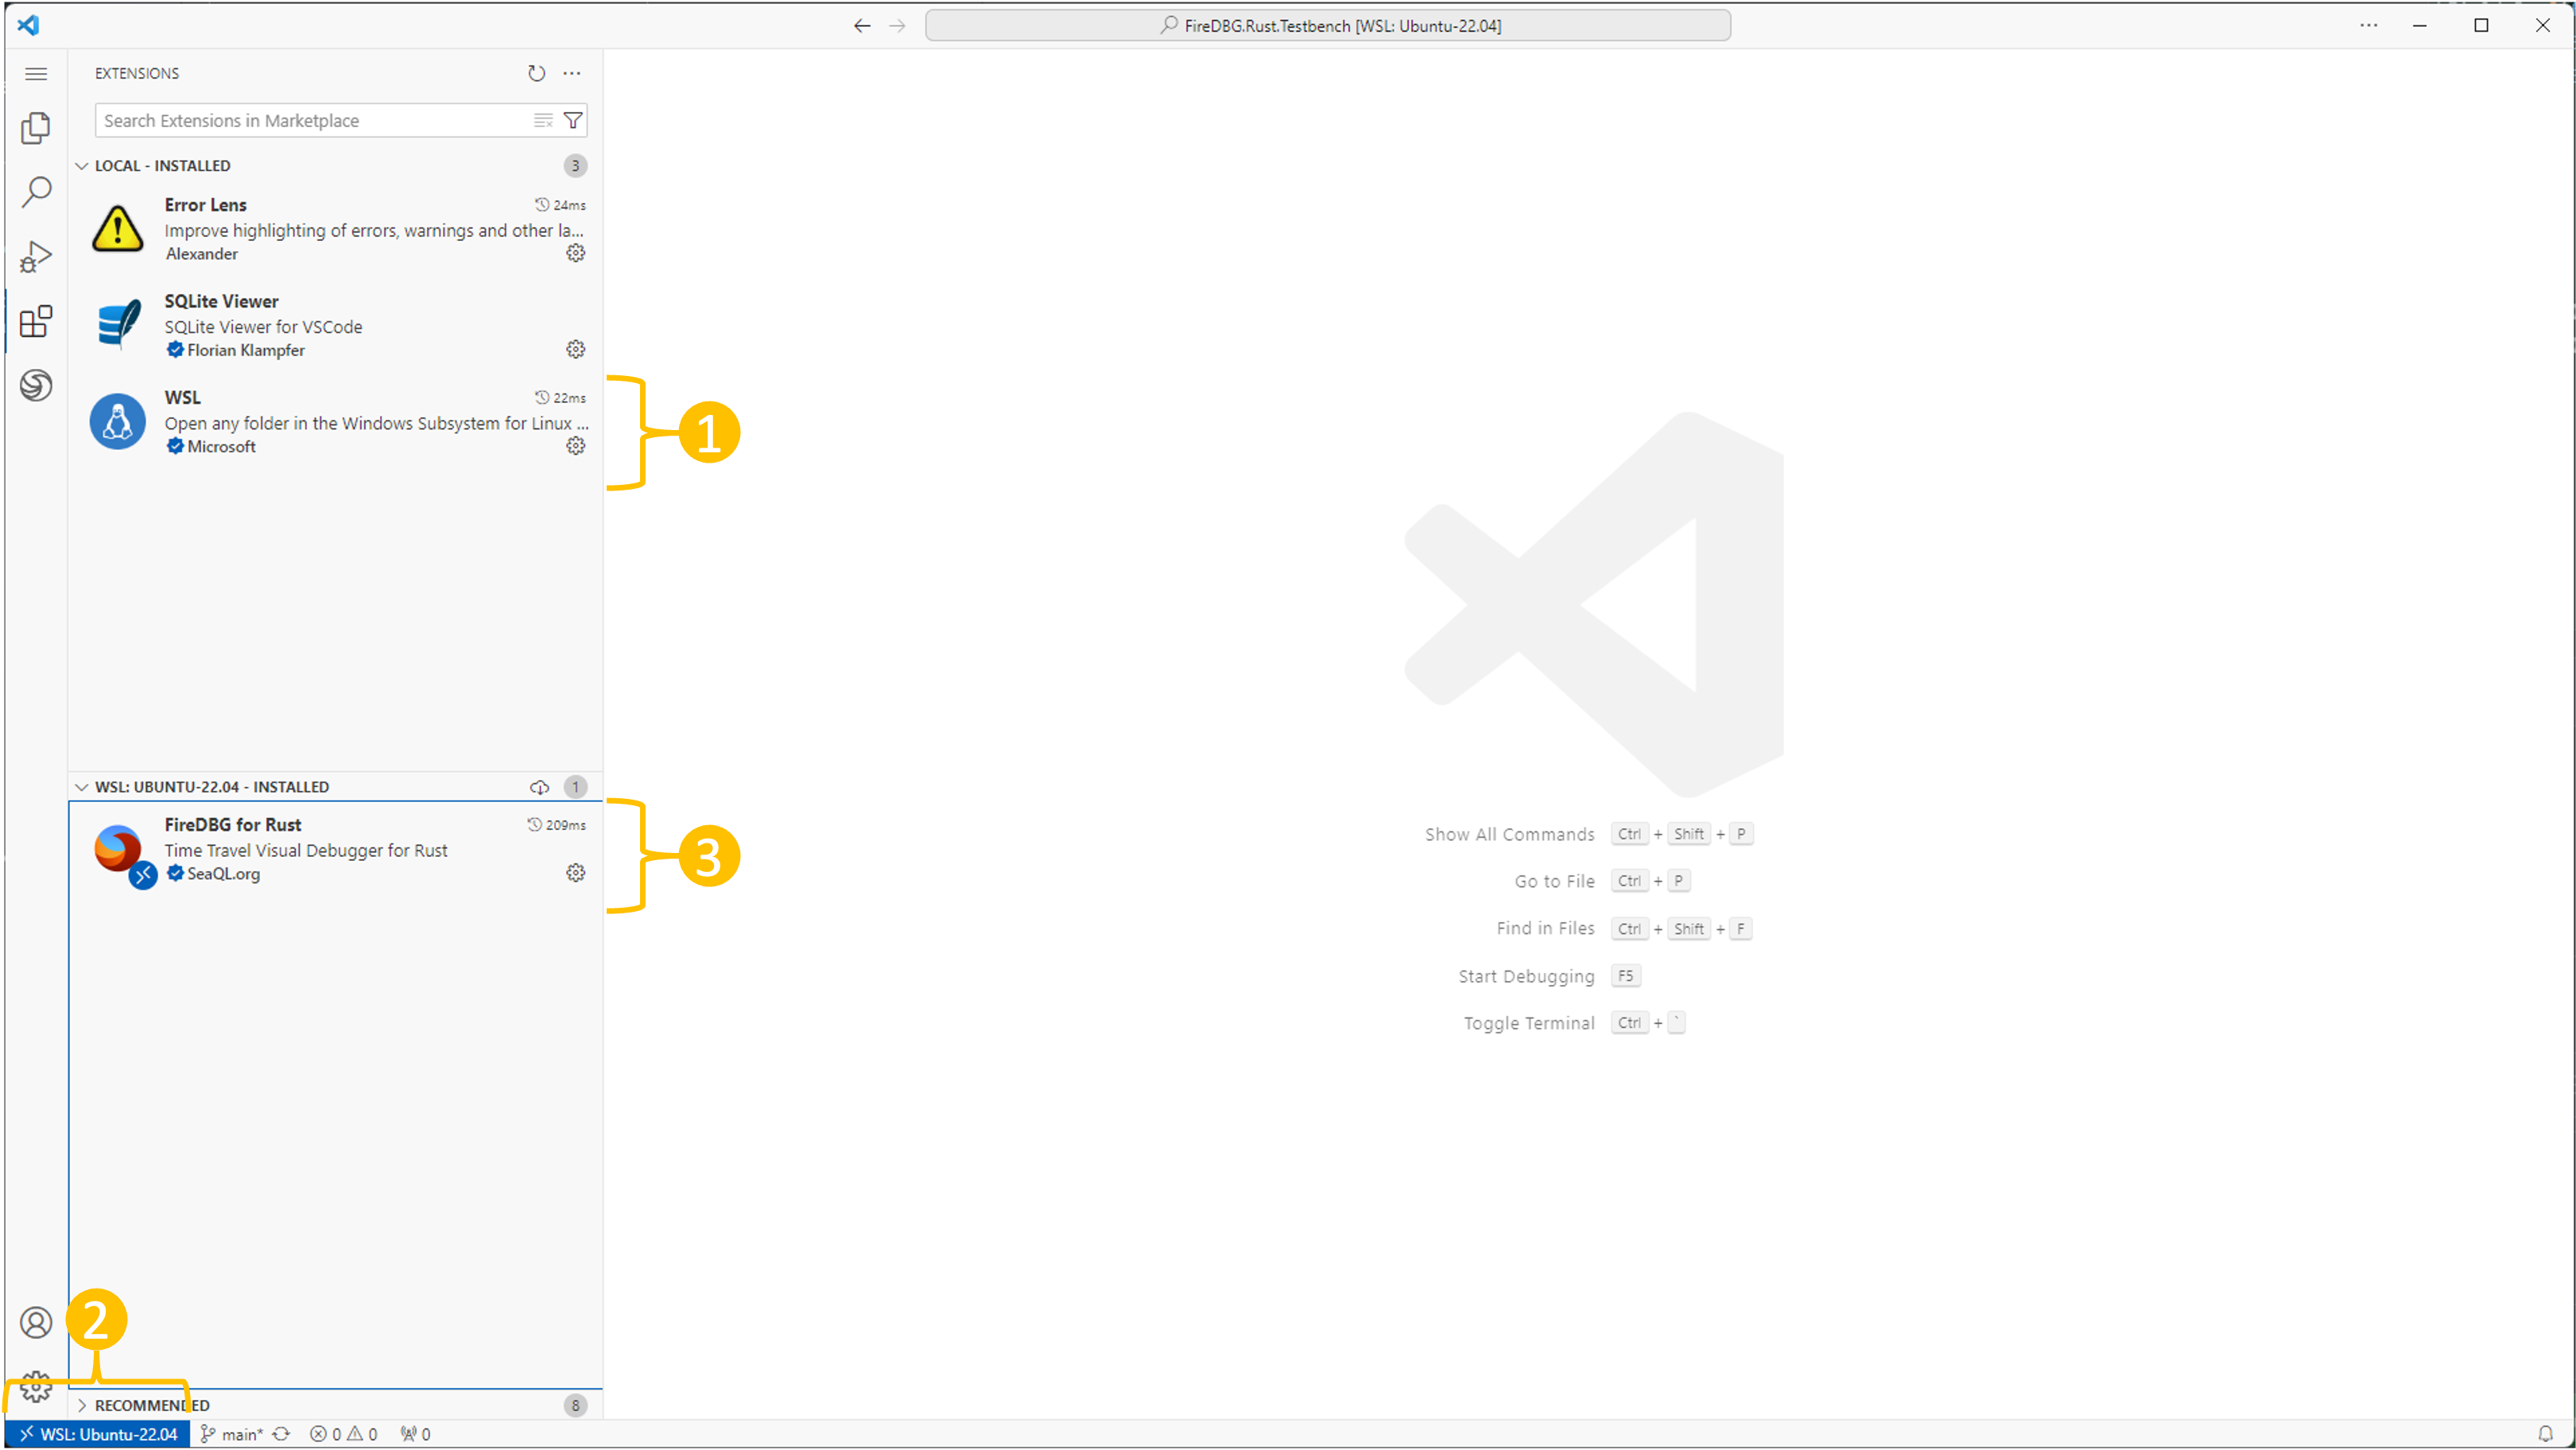
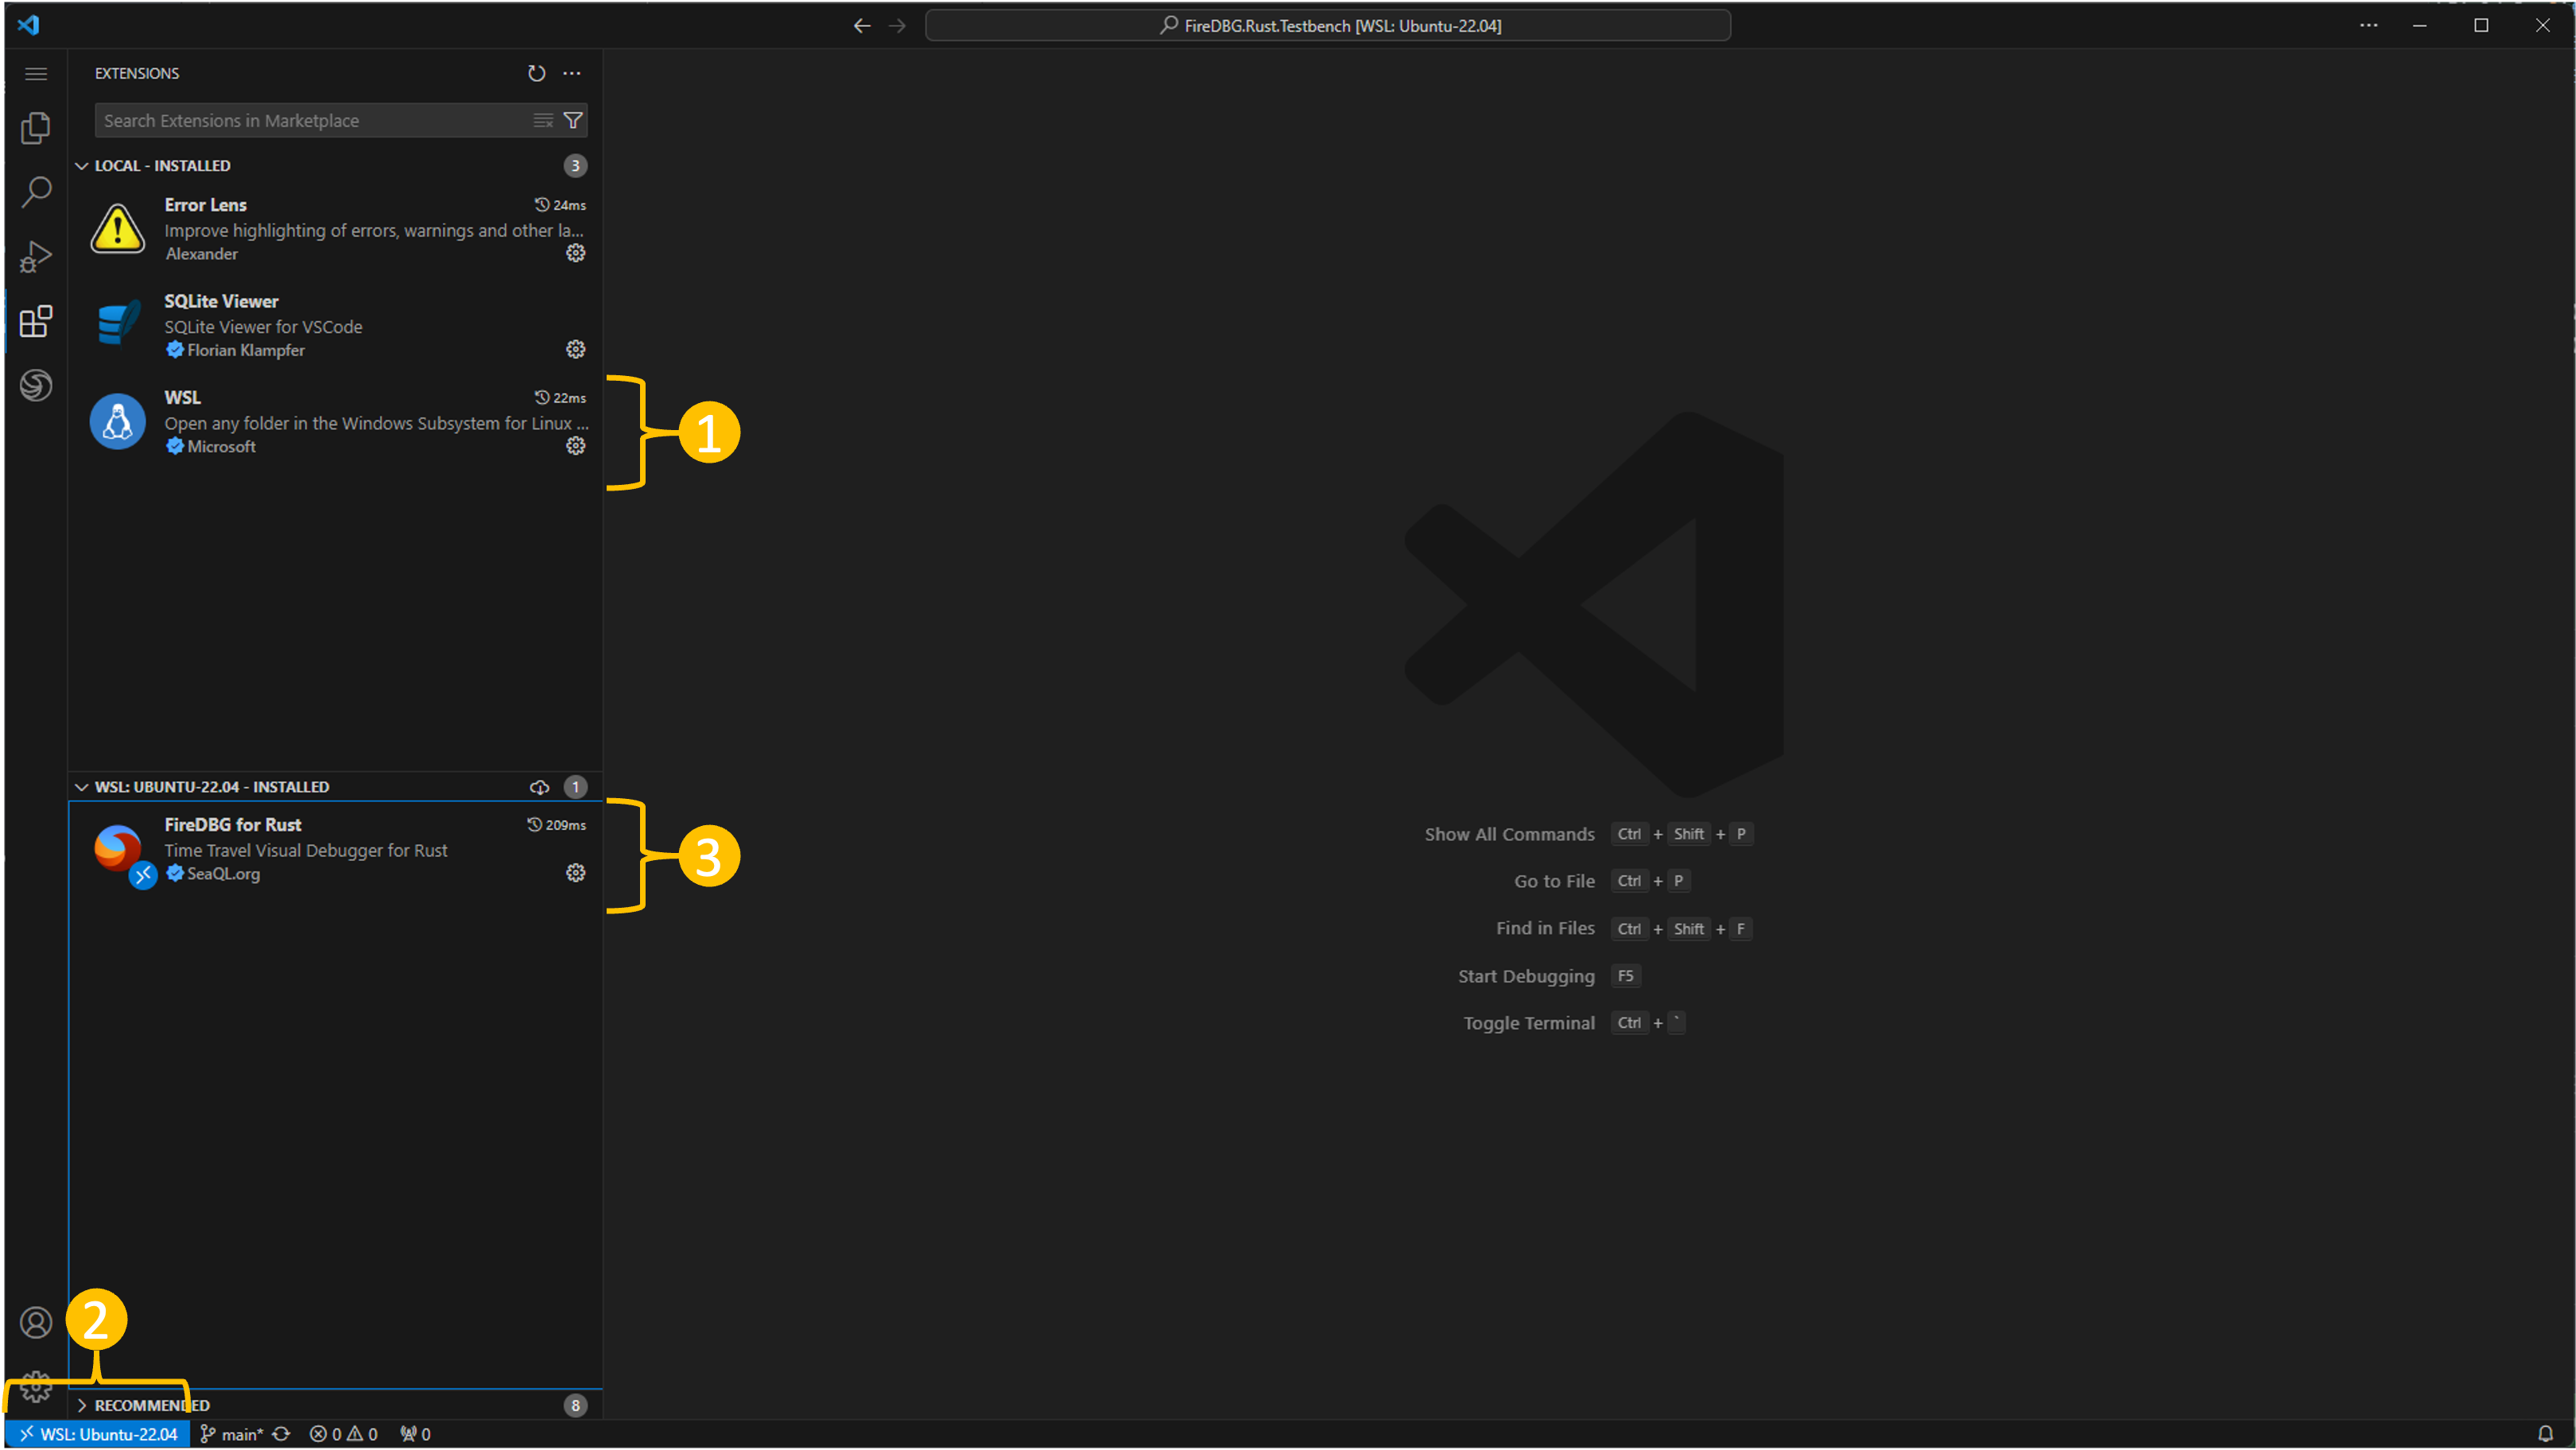
We only support Windows under WSL 2 right now, so please follow these steps on Windows:
- Install Ubuntu 22.04
- Install the WSL extension
- Click
><on the bottom left, and select "Connect to WSL" - Install the
FireDBGextension
FireDBG Binaries
To keep the .vsix package small in size, we dont't ship the platform-specific binaries with the Extension.
Instead, we have a dedicated installer script for the FireDBG binaries. We provide prebuilt binaries for the following CPU and OS combination:
| Linux1 | macOS2 | Windows (WSL 2)3 | |
|---|---|---|---|
| x64 | ✅ | ✅ Intel | ✅ |
| arm64 | ⛔️ | ✅ Apple | ⛔️ |
Once the the Extension has been installed, you should see a prompt hinting that FireDBG binaries are missing. Click on the "install" button to run the installer.
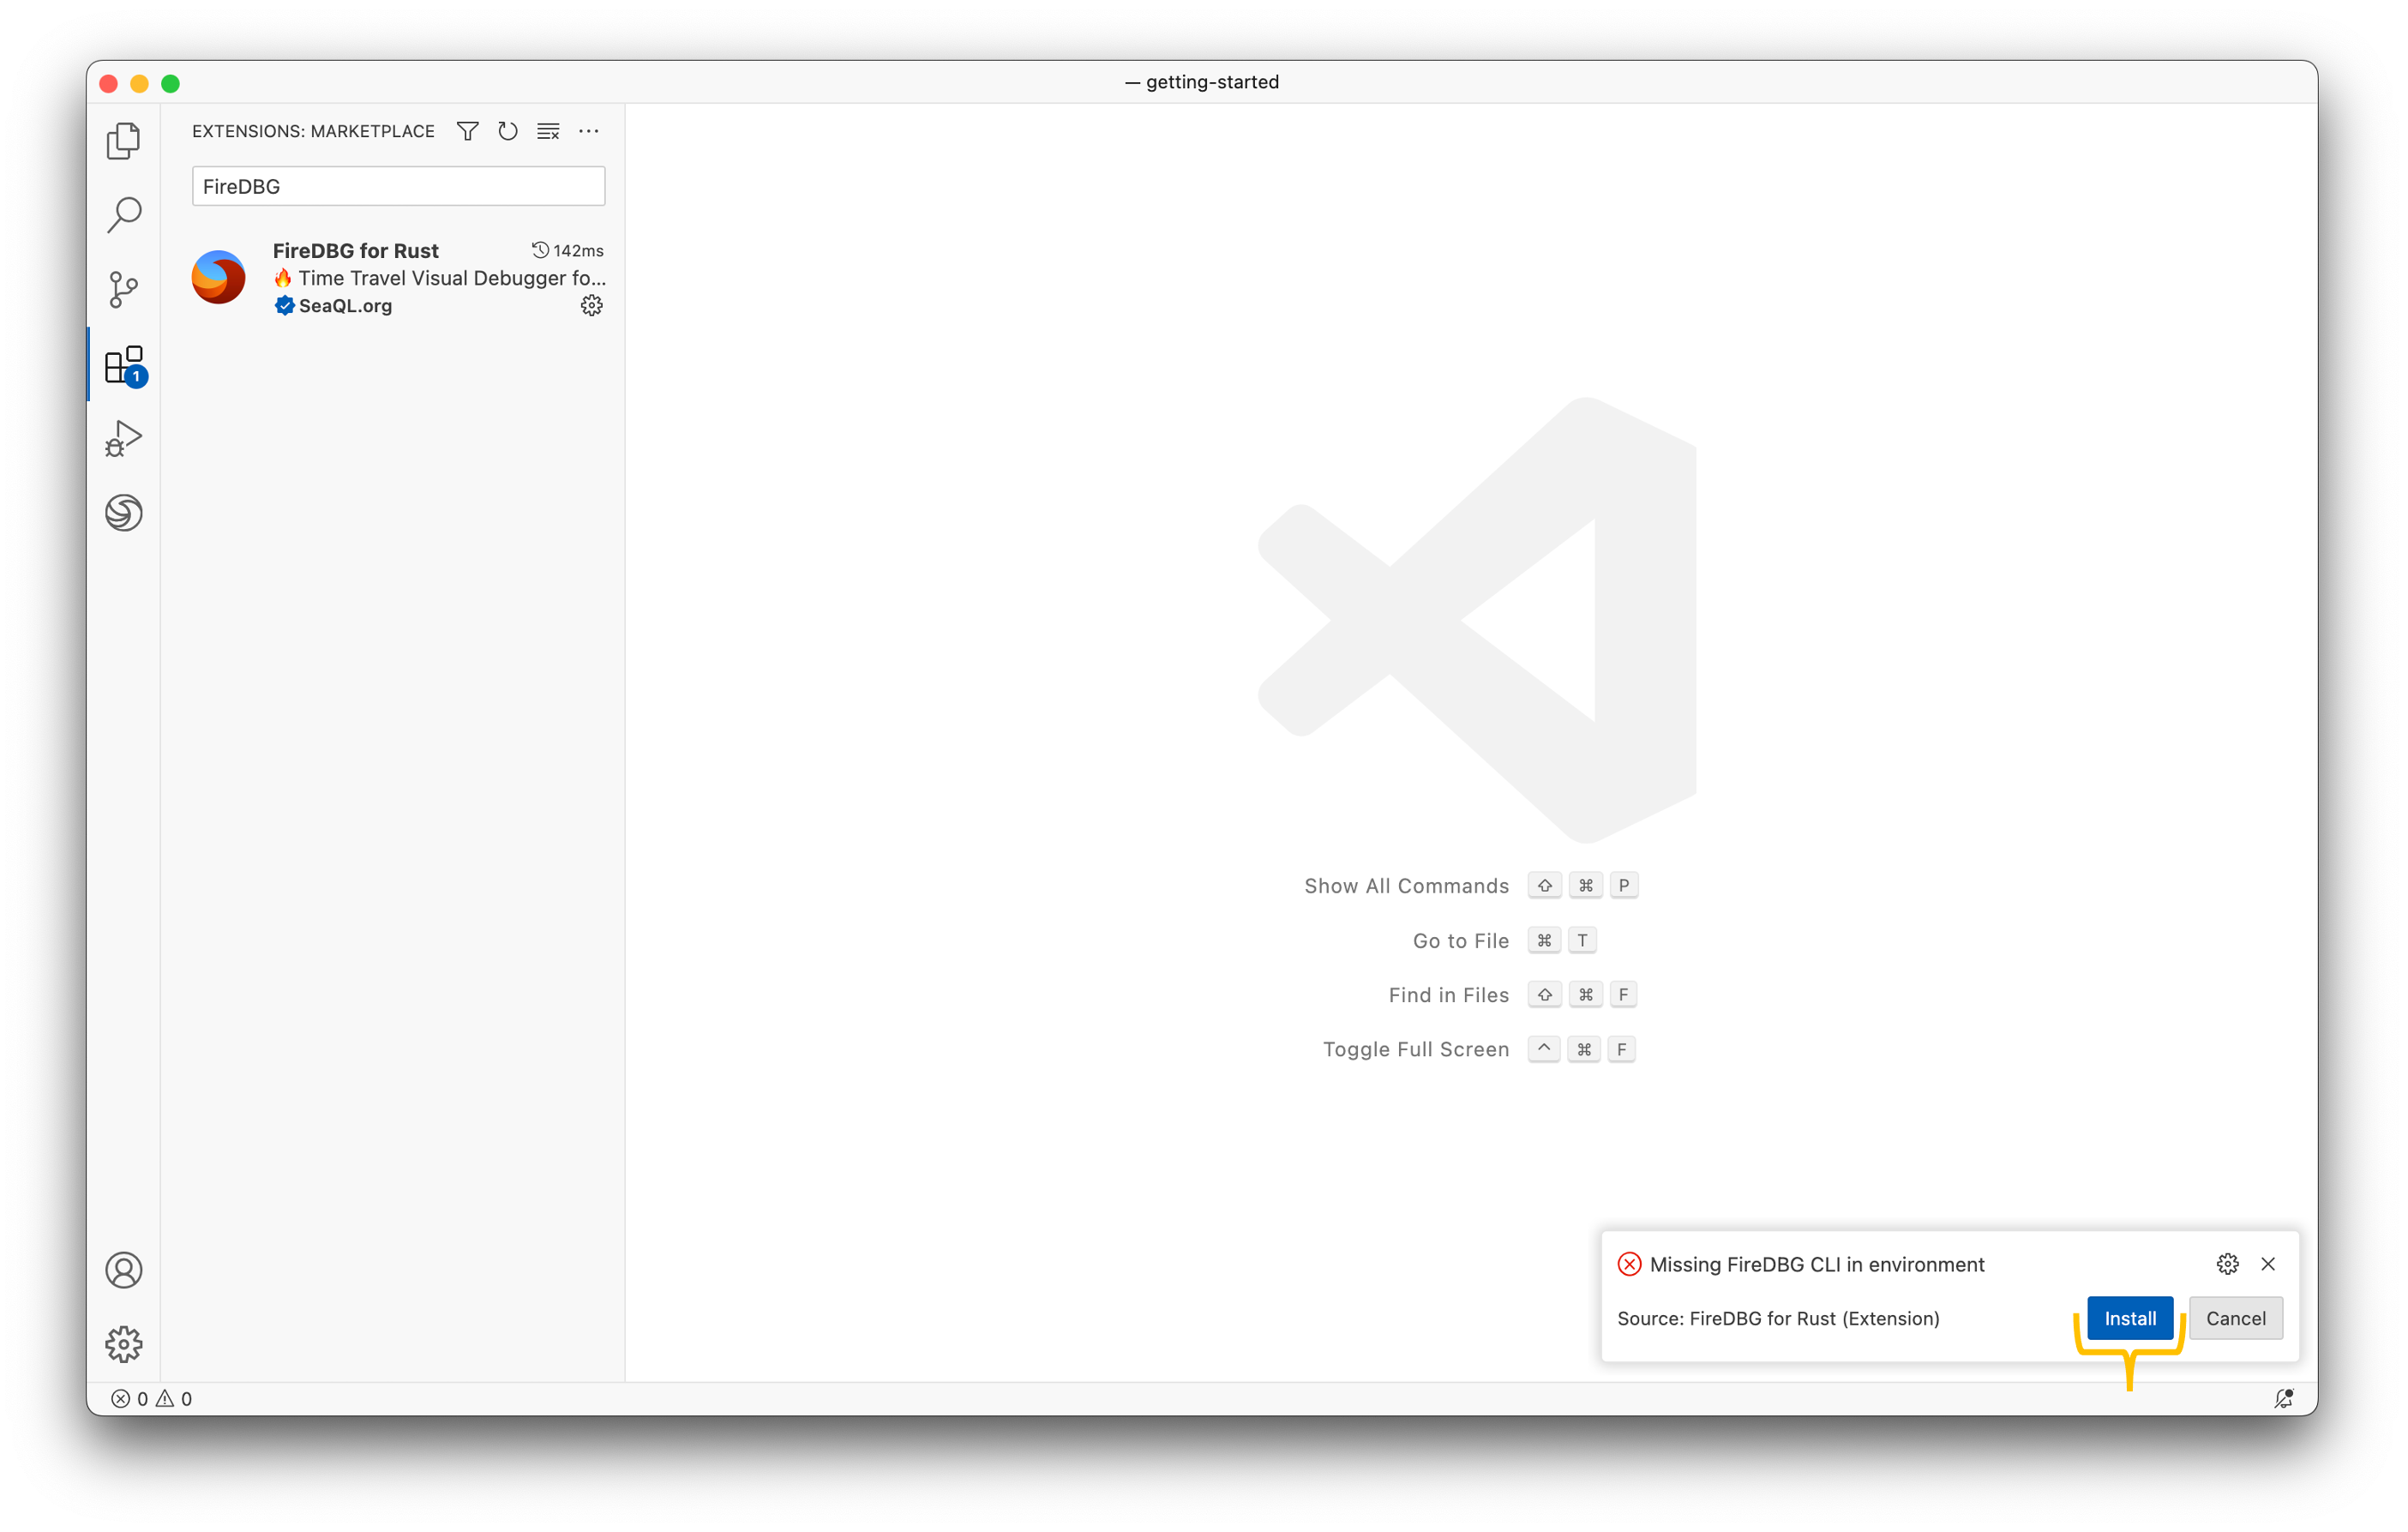
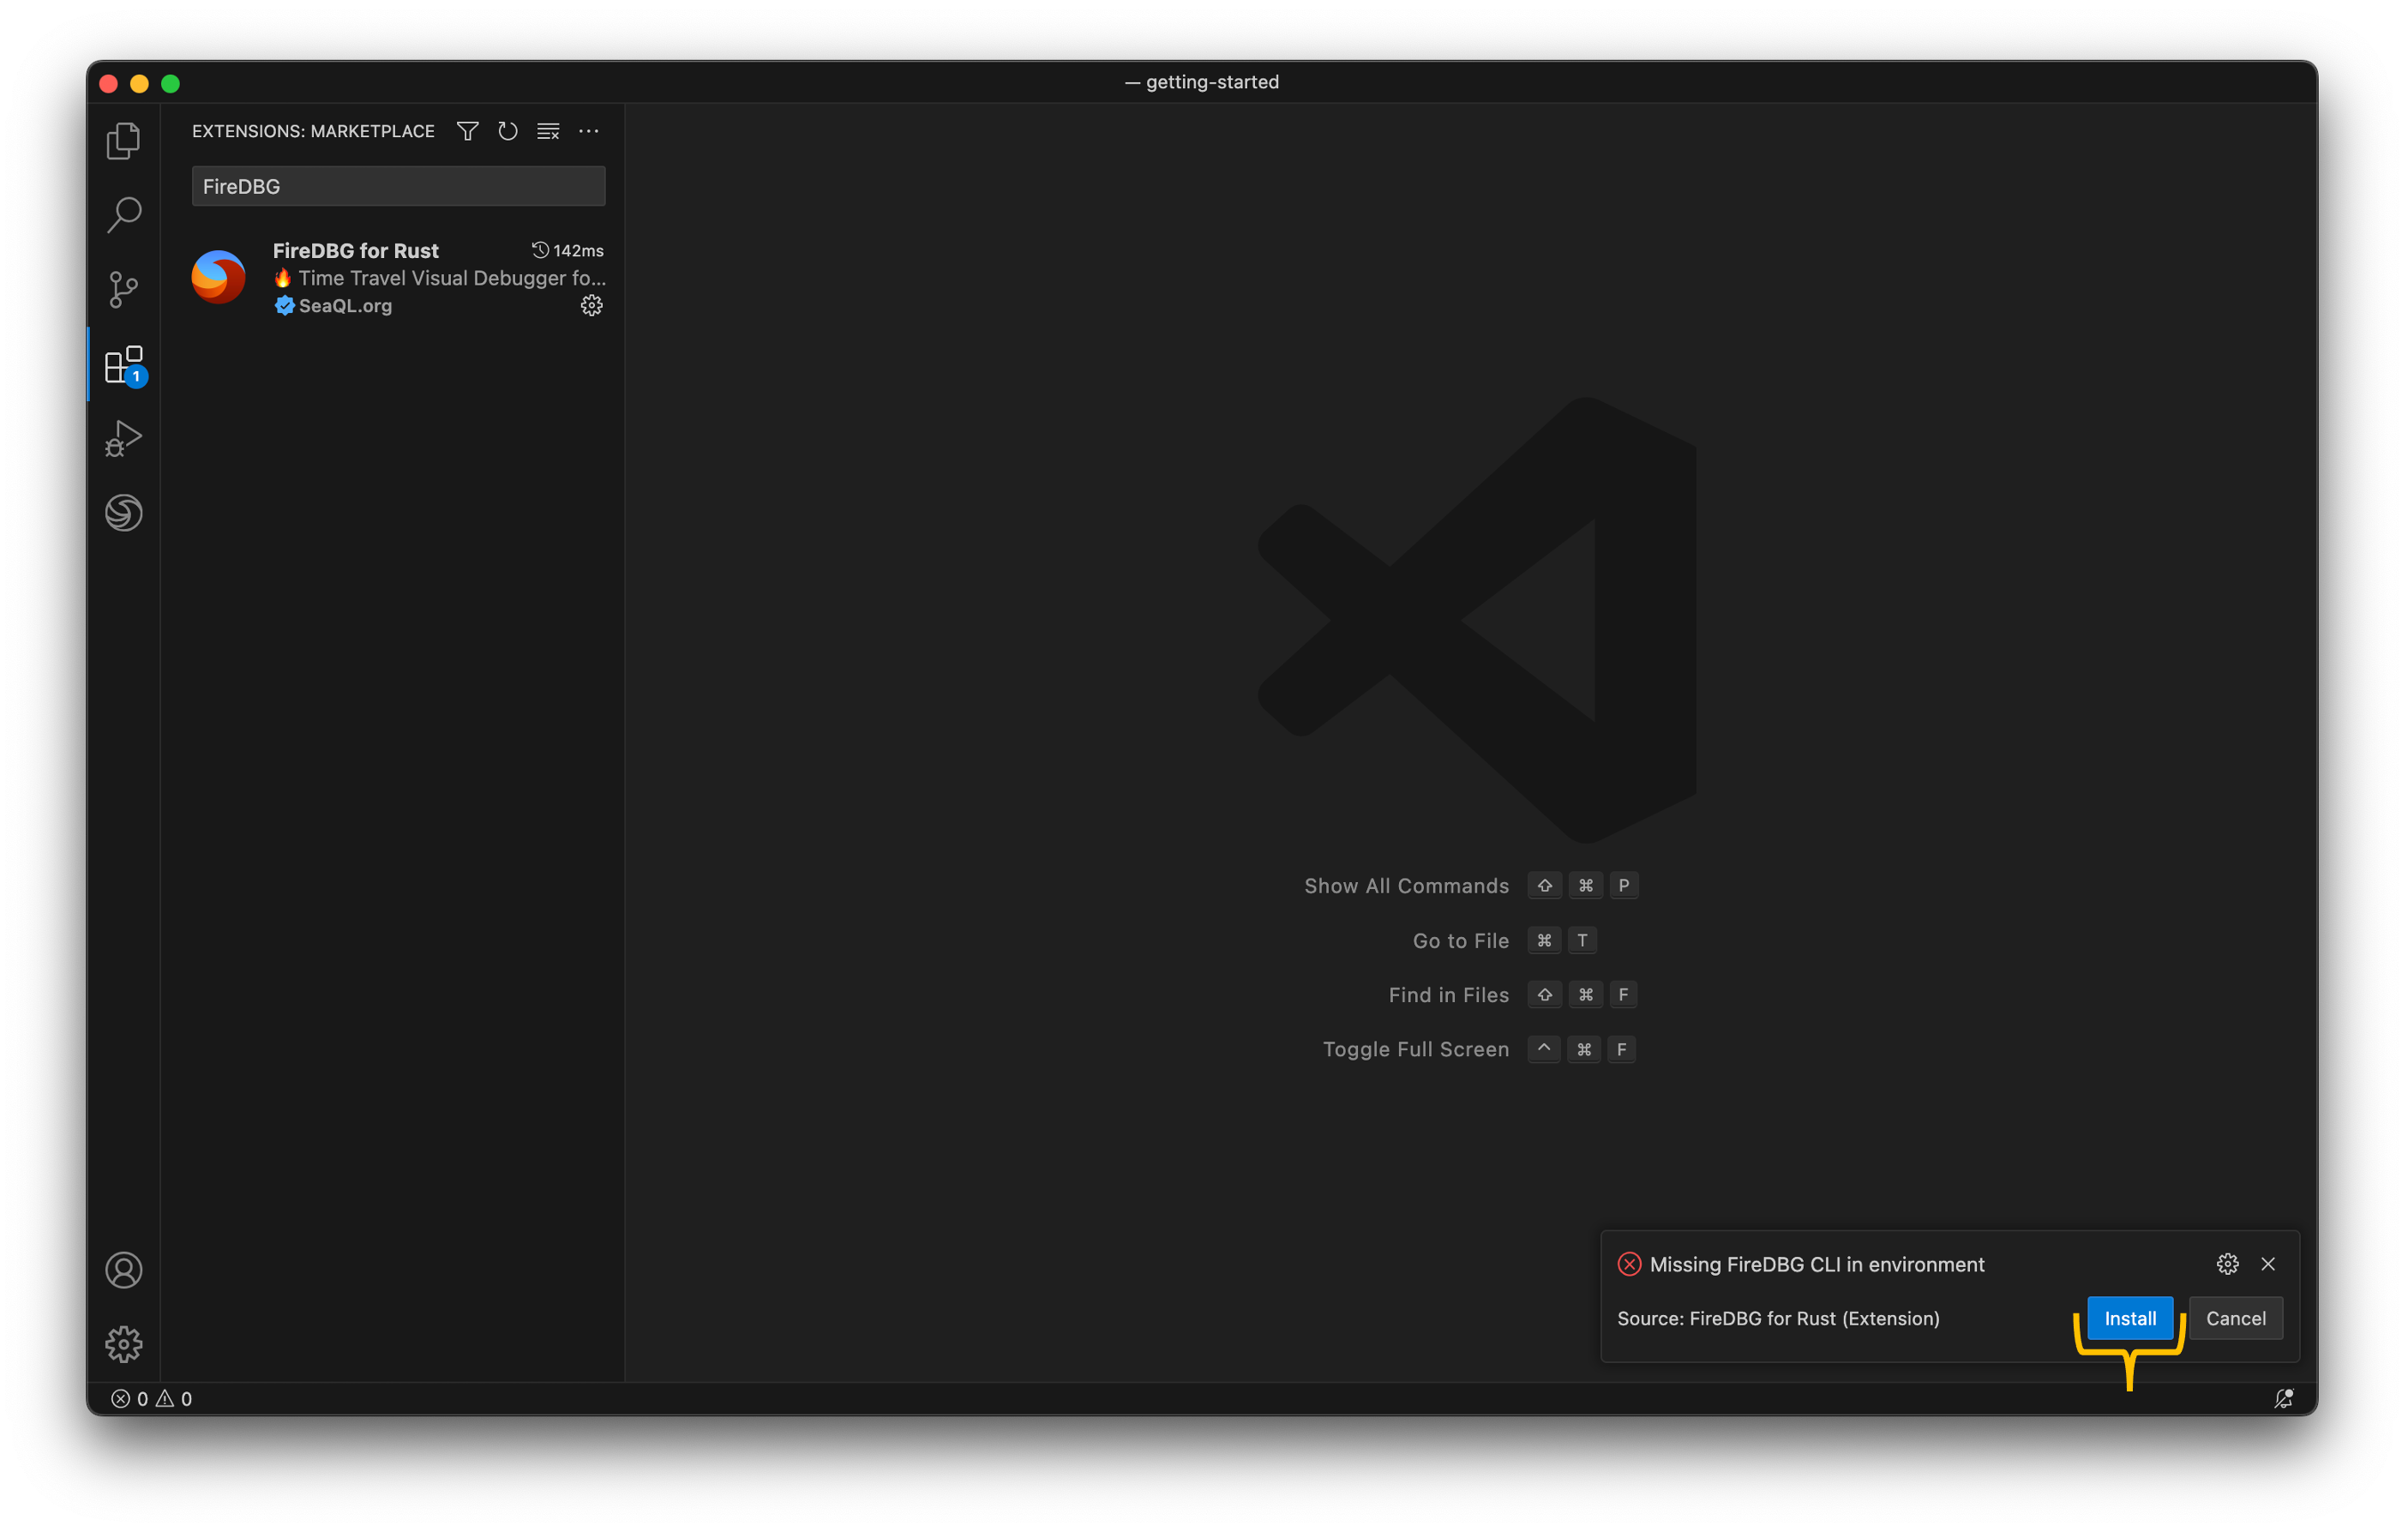
Or, you can run the installer manually.
curl https://raw.githubusercontent.com/SeaQL/FireDBG.for.Rust/main/install.sh -sSf | sh
FireDBG binaries will be installed in ~/.cargo/bin and a debugger self test will be conducted to verify the installation. Expect to see:
info: completed FireDBG self tests
In case you got error messages when performing self test, read Troubleshooting Guide for the solution of common errors.
GUI Tour
Download the zipped source code, or cloning Rust Testbench for FireDBG to your local machine, then follow the tour below to learn the basic usage of the Extension.
git clone git@github.com:SeaQL/FireDBG.Rust.Testbench.git
Note that the root directory of testbench isn't a Cargo workspace. In the next section, please open each sub-folder (e.g. getting-started) in VS Code. For convenience, each example already included a sample run.
Debug Targets and Runs
Where can I see the list of all debuggable Rust targets, how can I debug it and how to inspect previous runs?
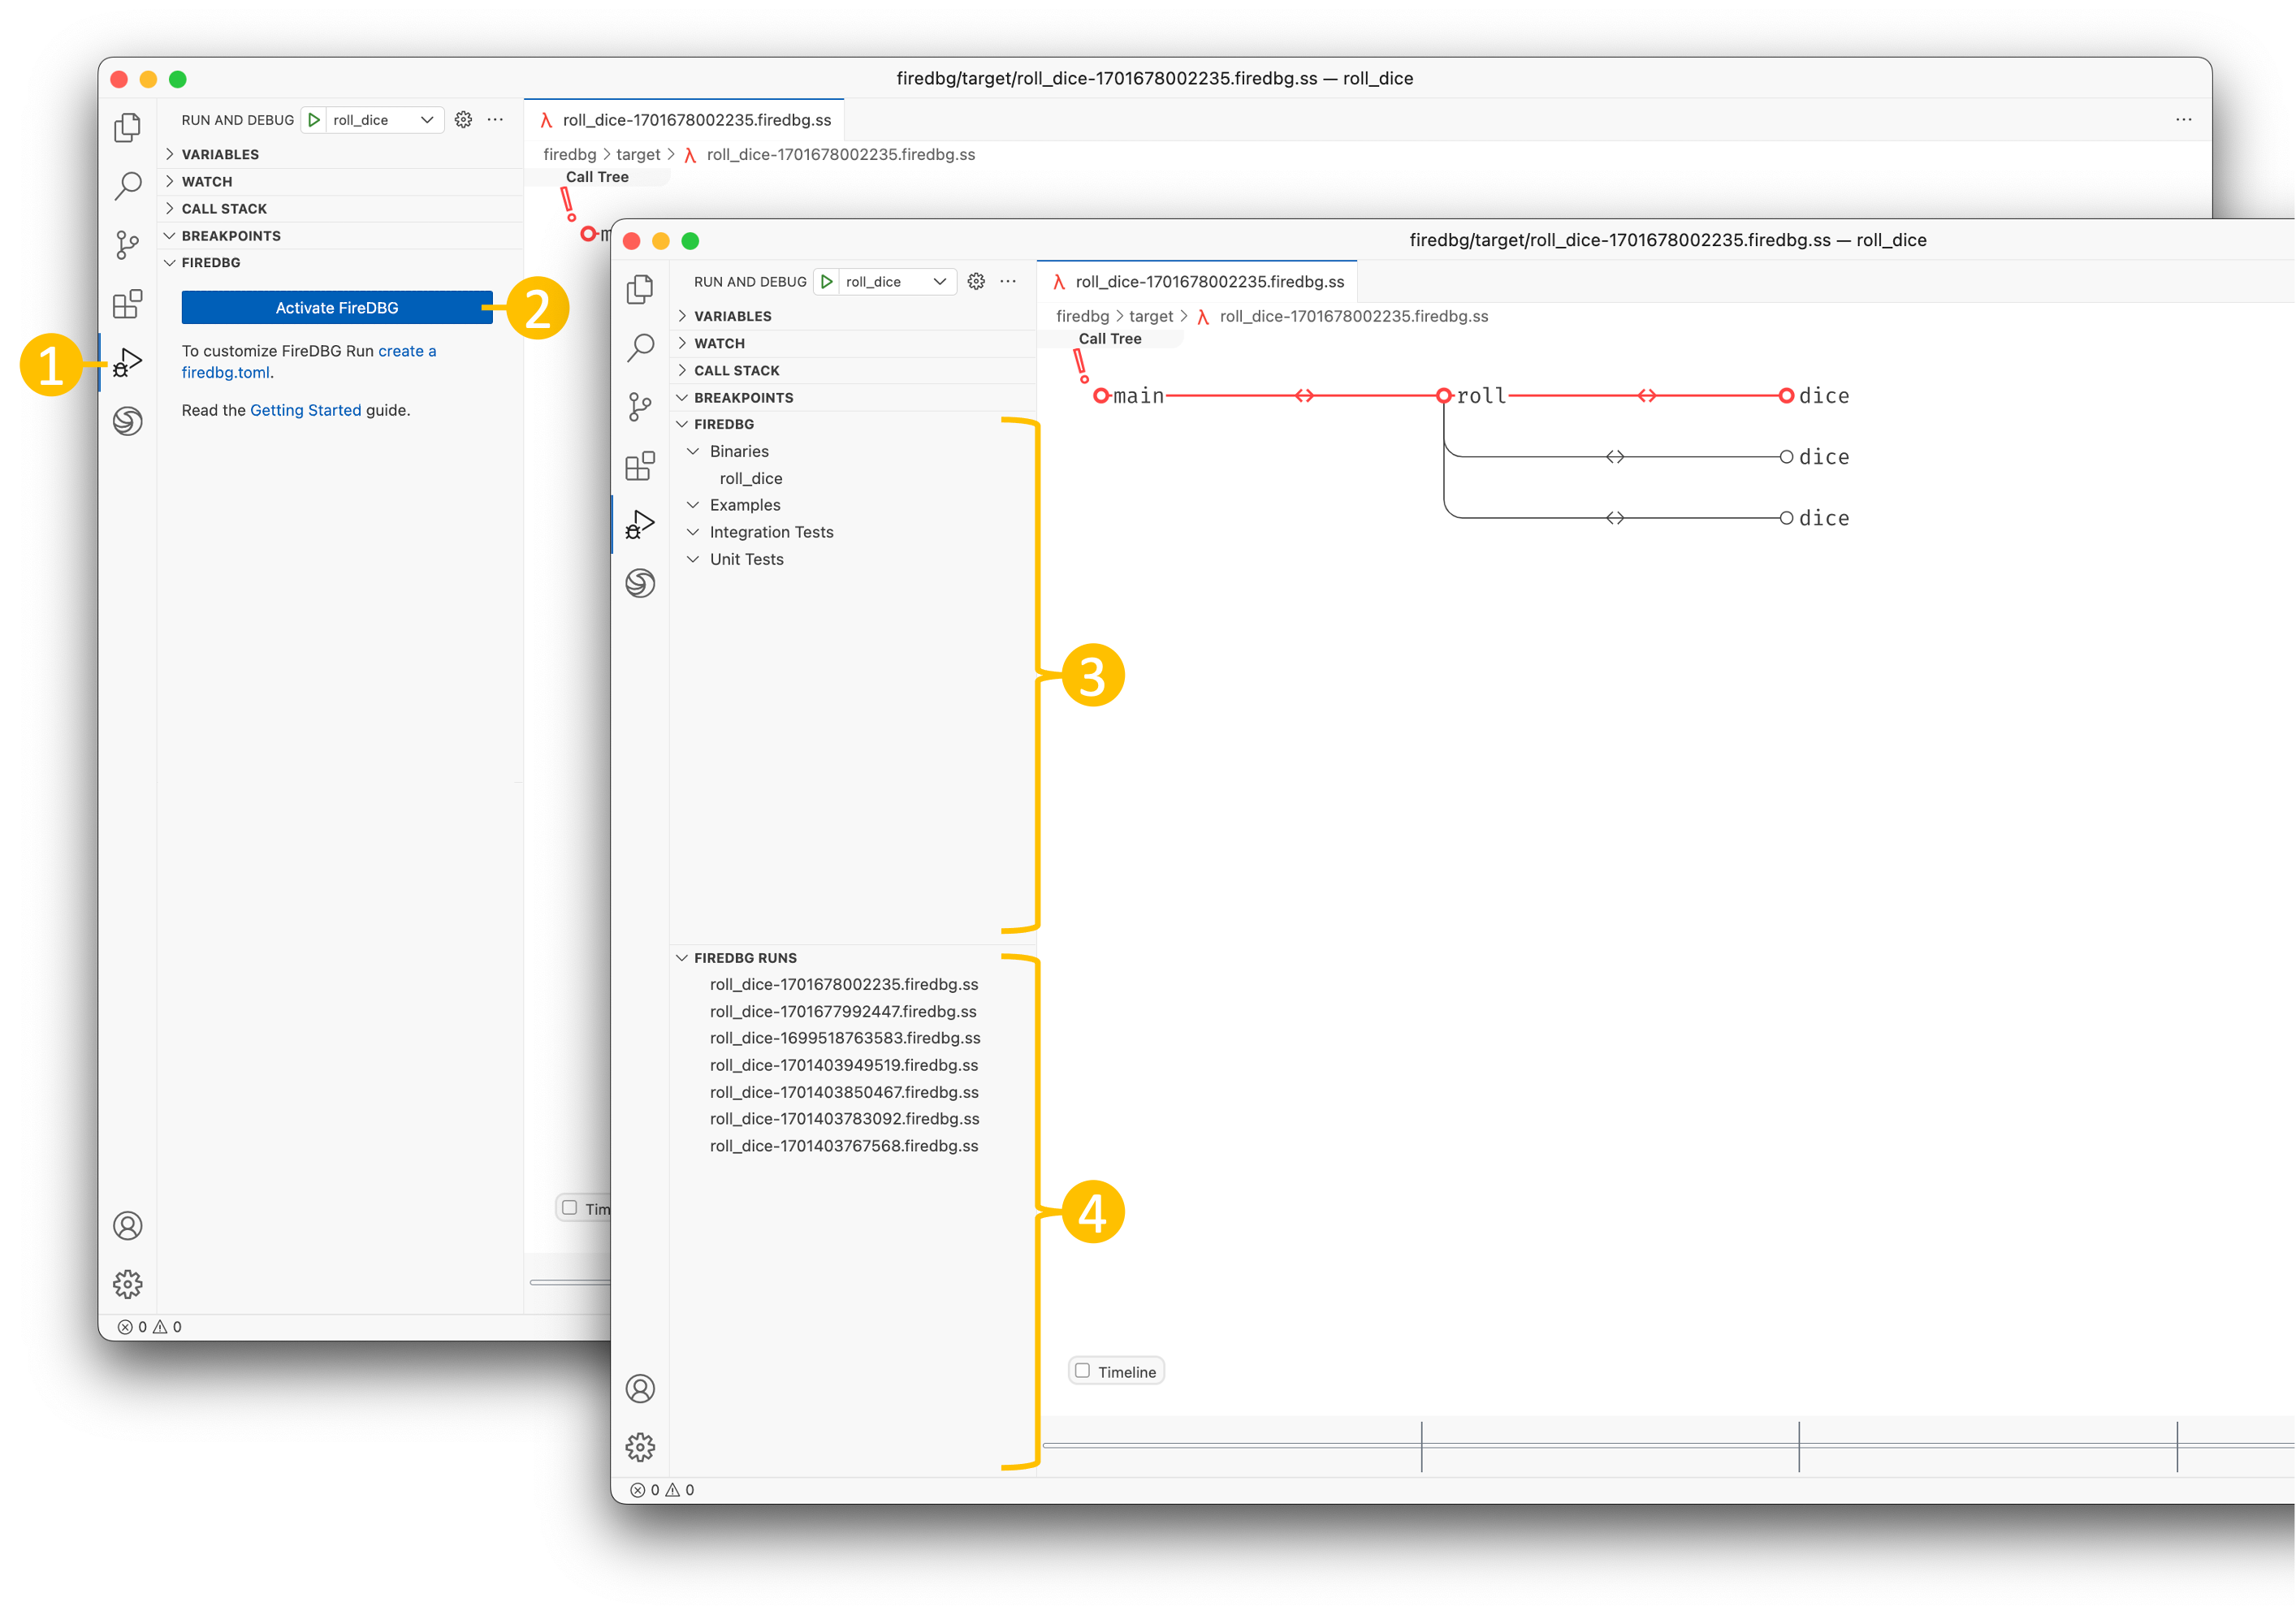
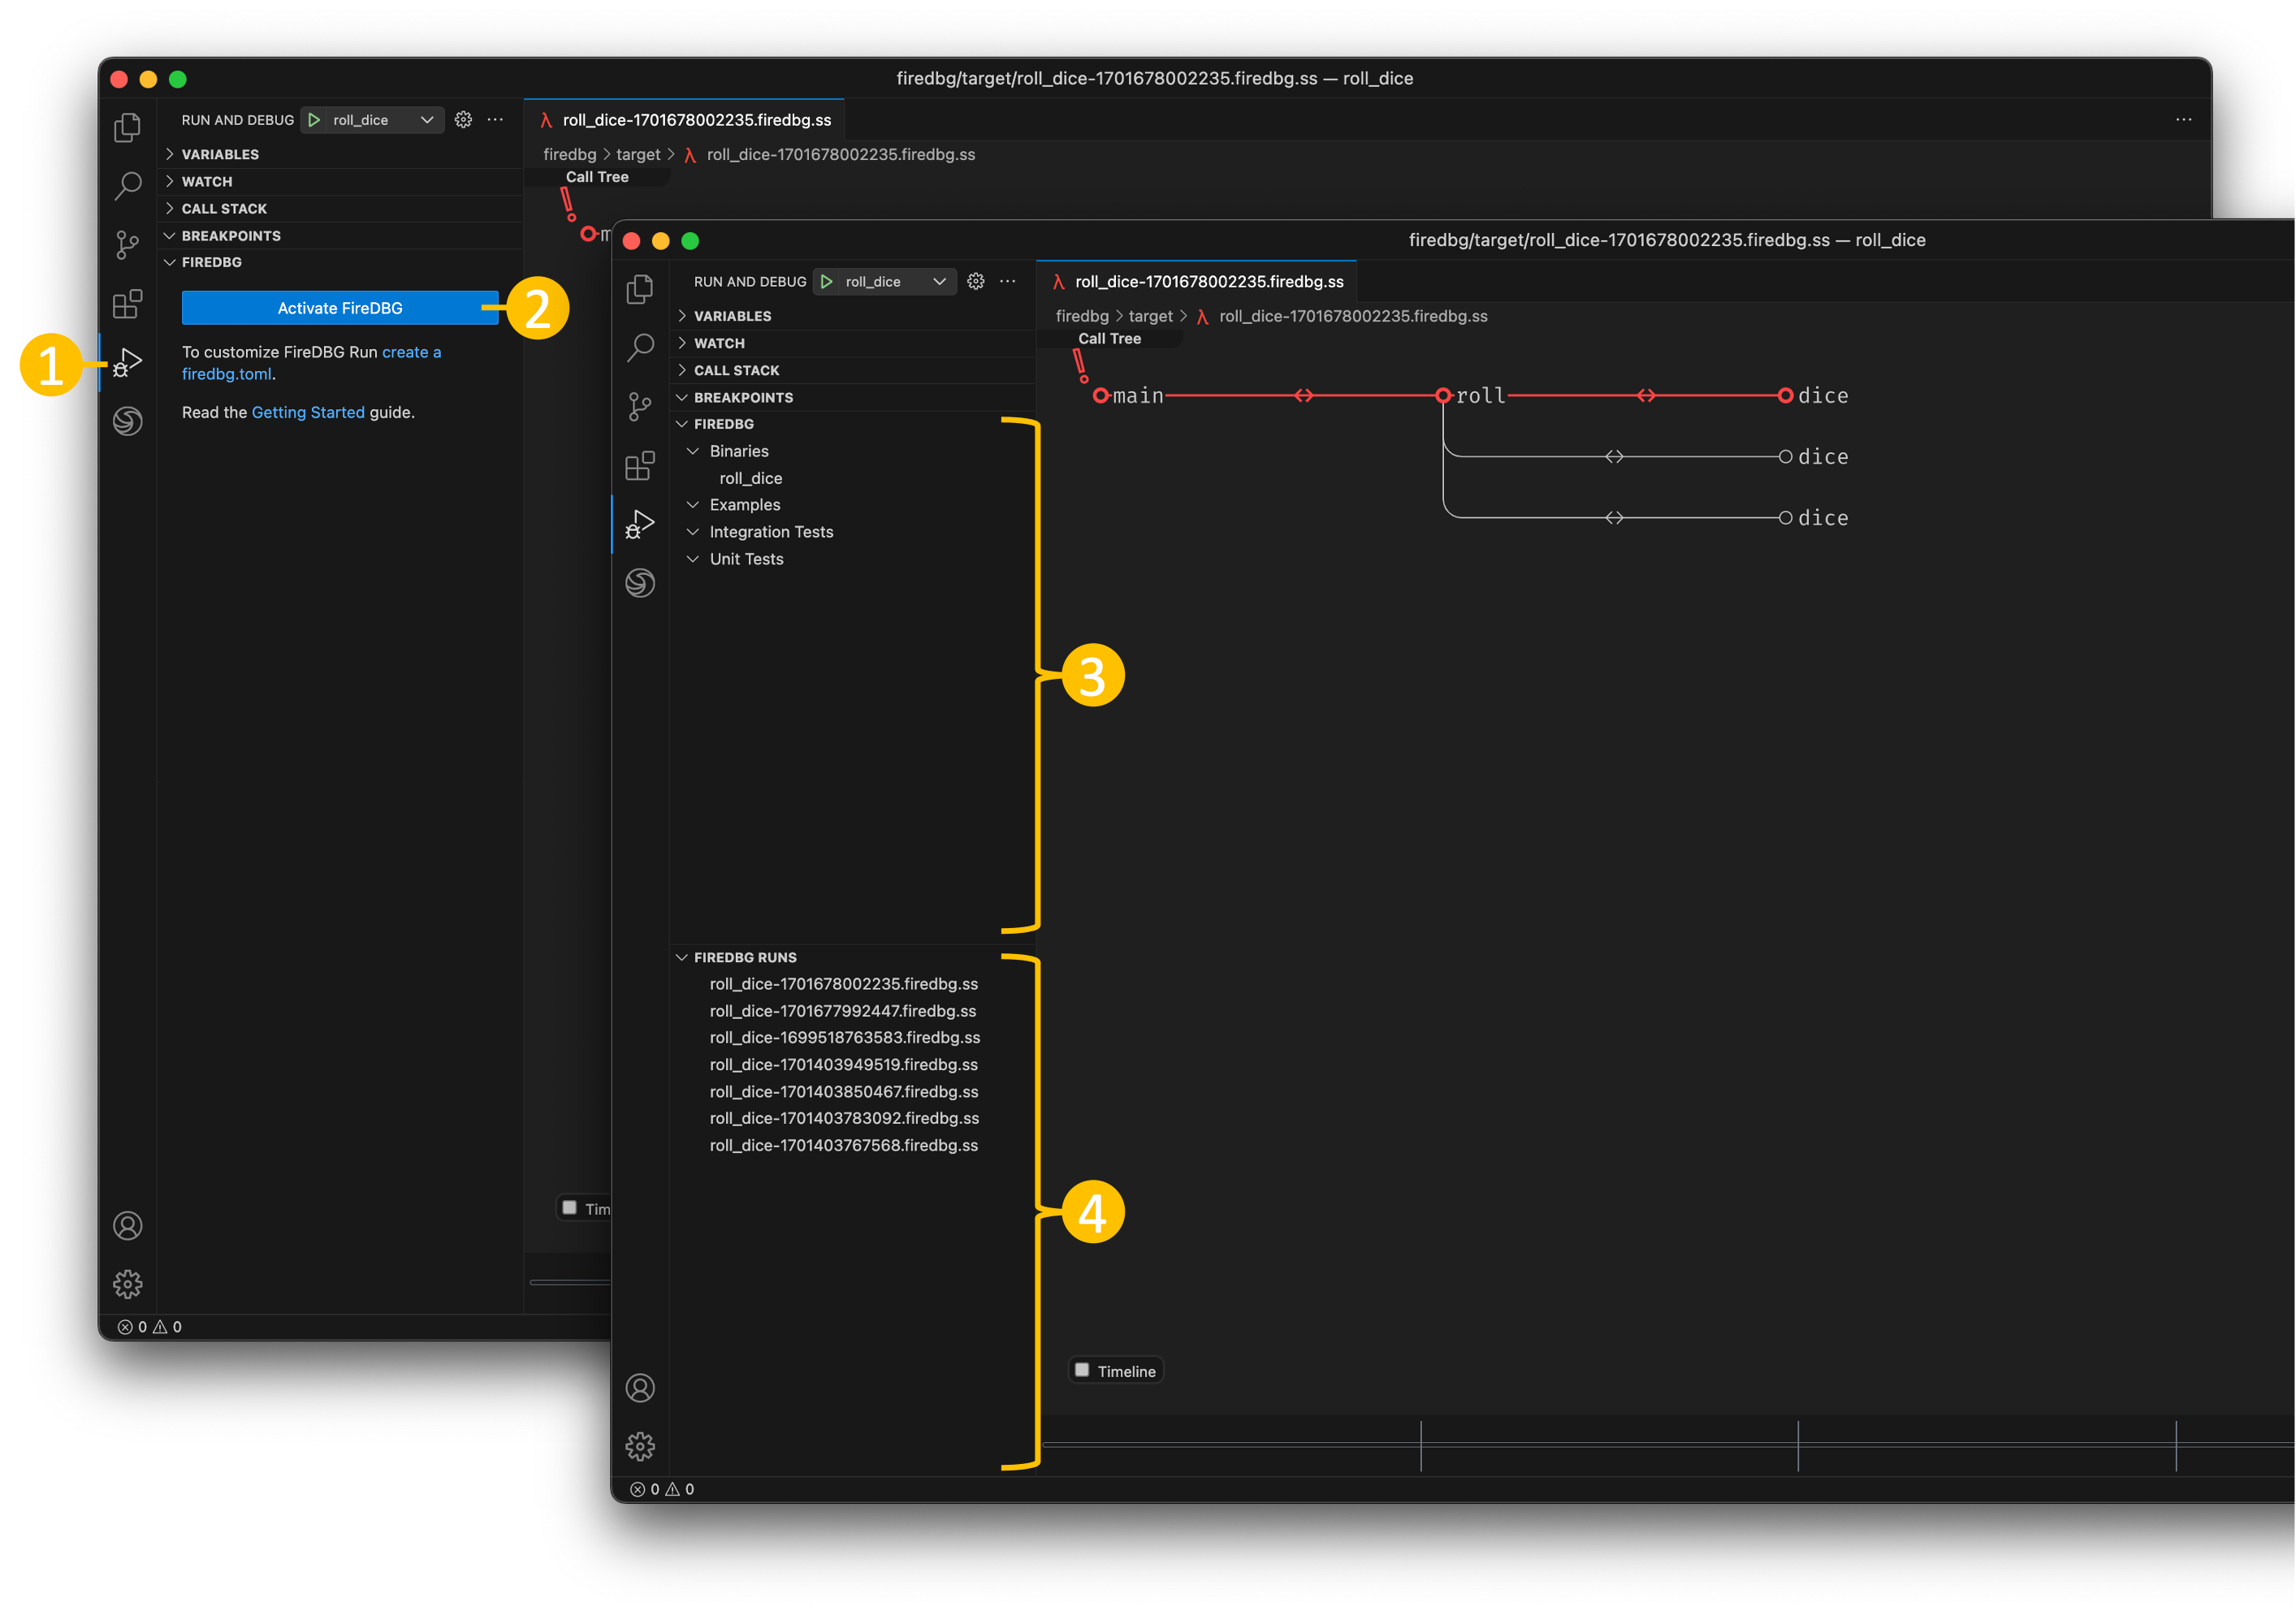
- Click on the "Run and Debug" panel on your primary sidebar, you should see two new panels on the bottom
- Click on the "Activate FireDBG" to enable FireDBG debugger on this workspace
- The
FIREDBGpanel should display all binaries, examples, integration tests and unit tests in your current Rust workspace. Click on the list item to reveal the Rust source code. To debug it, hover the list item and click on the play icon ▶️ on the list item. A new debugger view will be shown and tail the progress in real time. - All previous debug runs can be found in the
FIREDBG RUNSpanel, simply click on it to open.
Alternatively, you can list all debuggable Rust targets with the CLI:
$ firedbg list-target

Available binaries are:
    roll_dice
And, list all previous runs with the CLI:
$ firedbg list-run

Available `firedbg` runs are:
    1) roll_dice-1701678002235.firedbg.ss
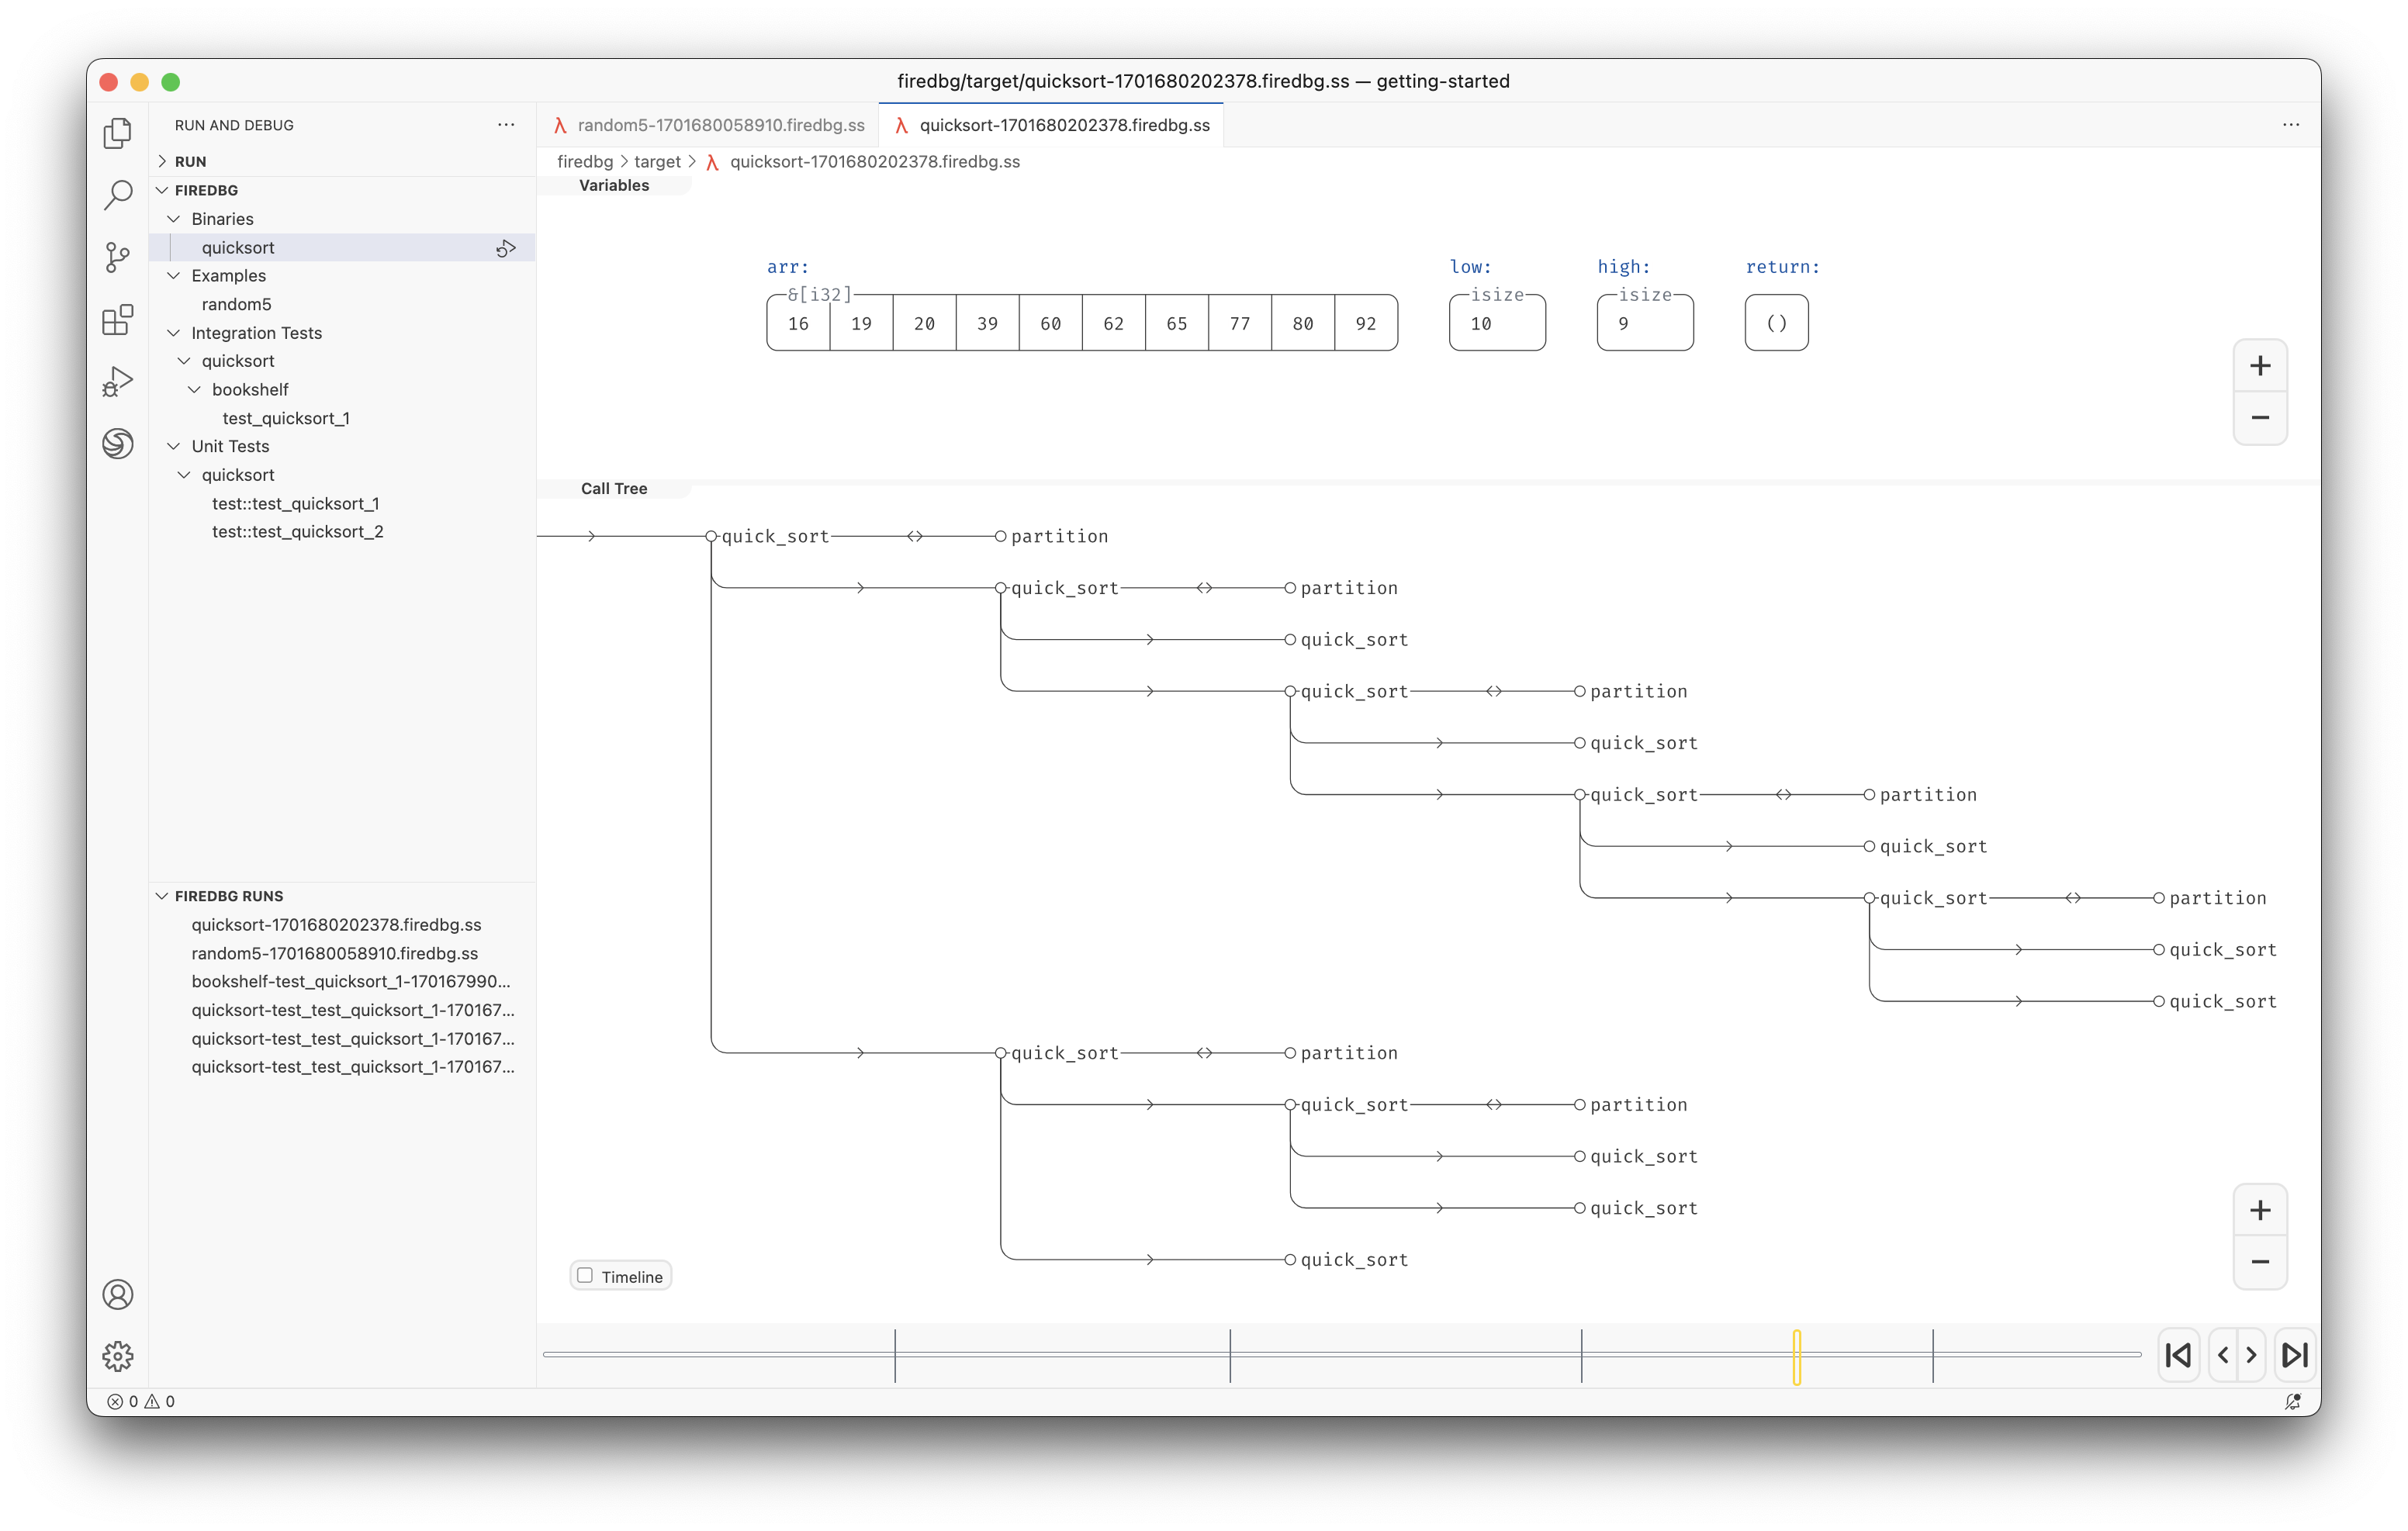
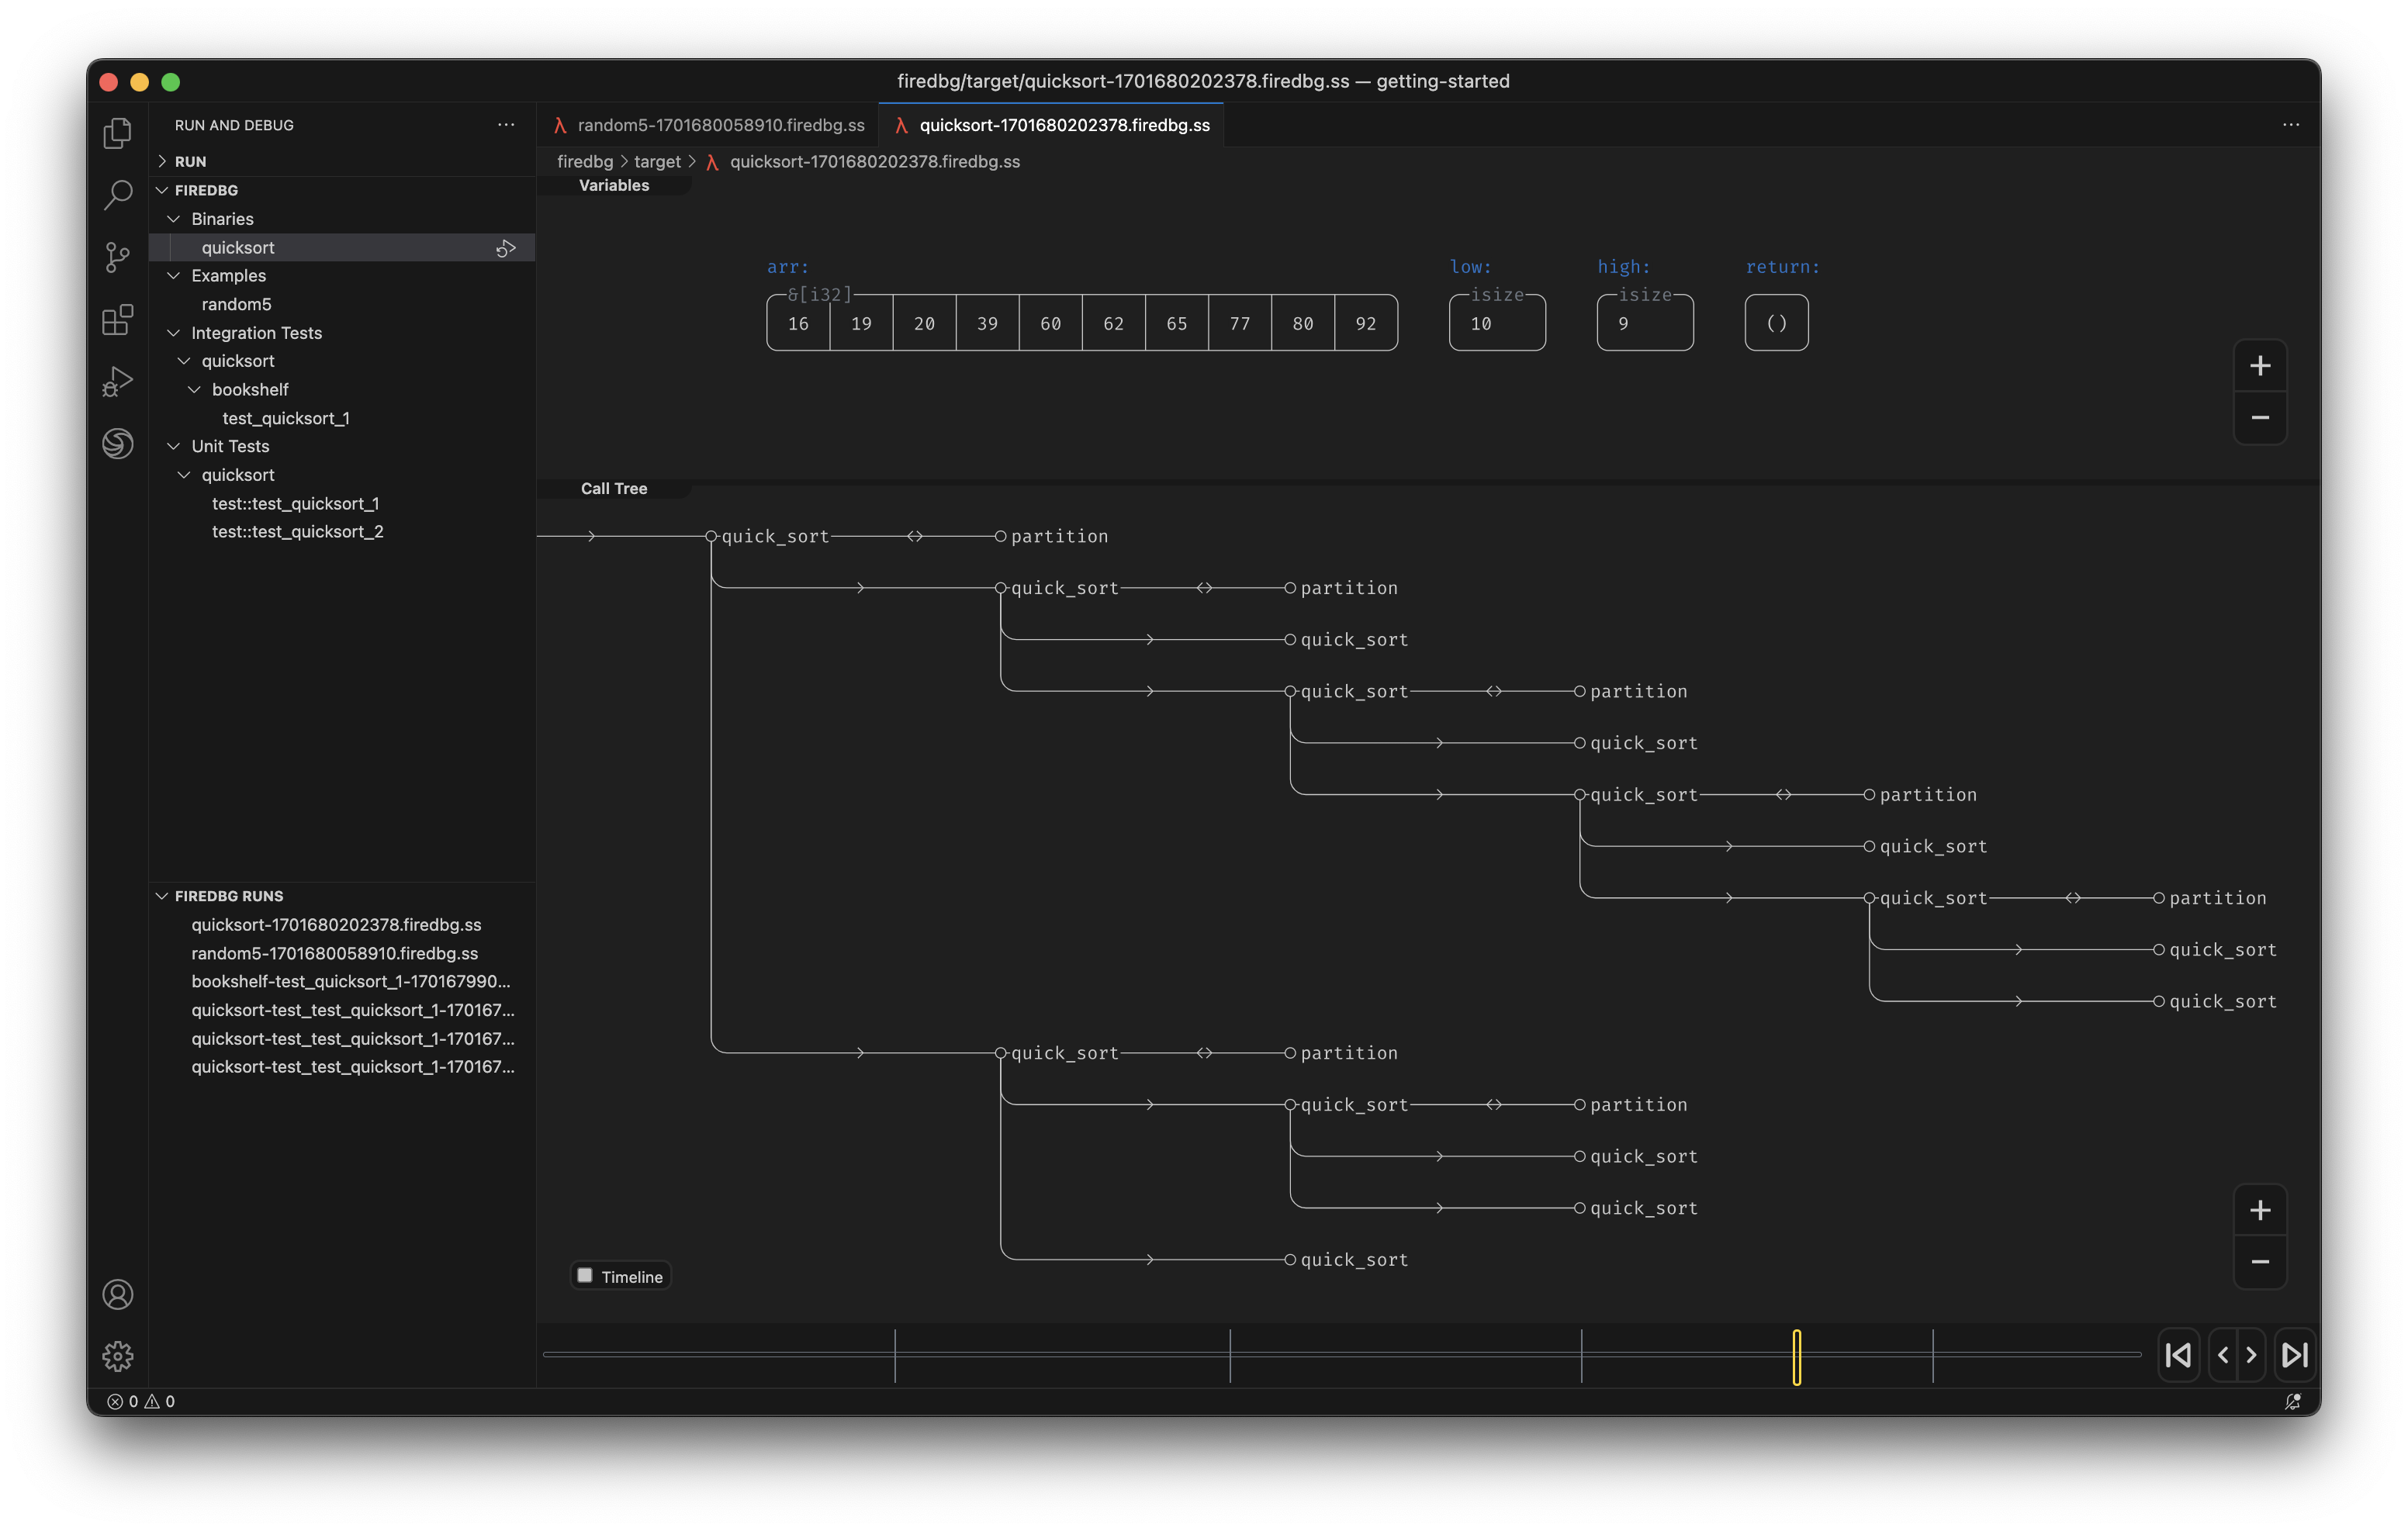
Visual Debugger
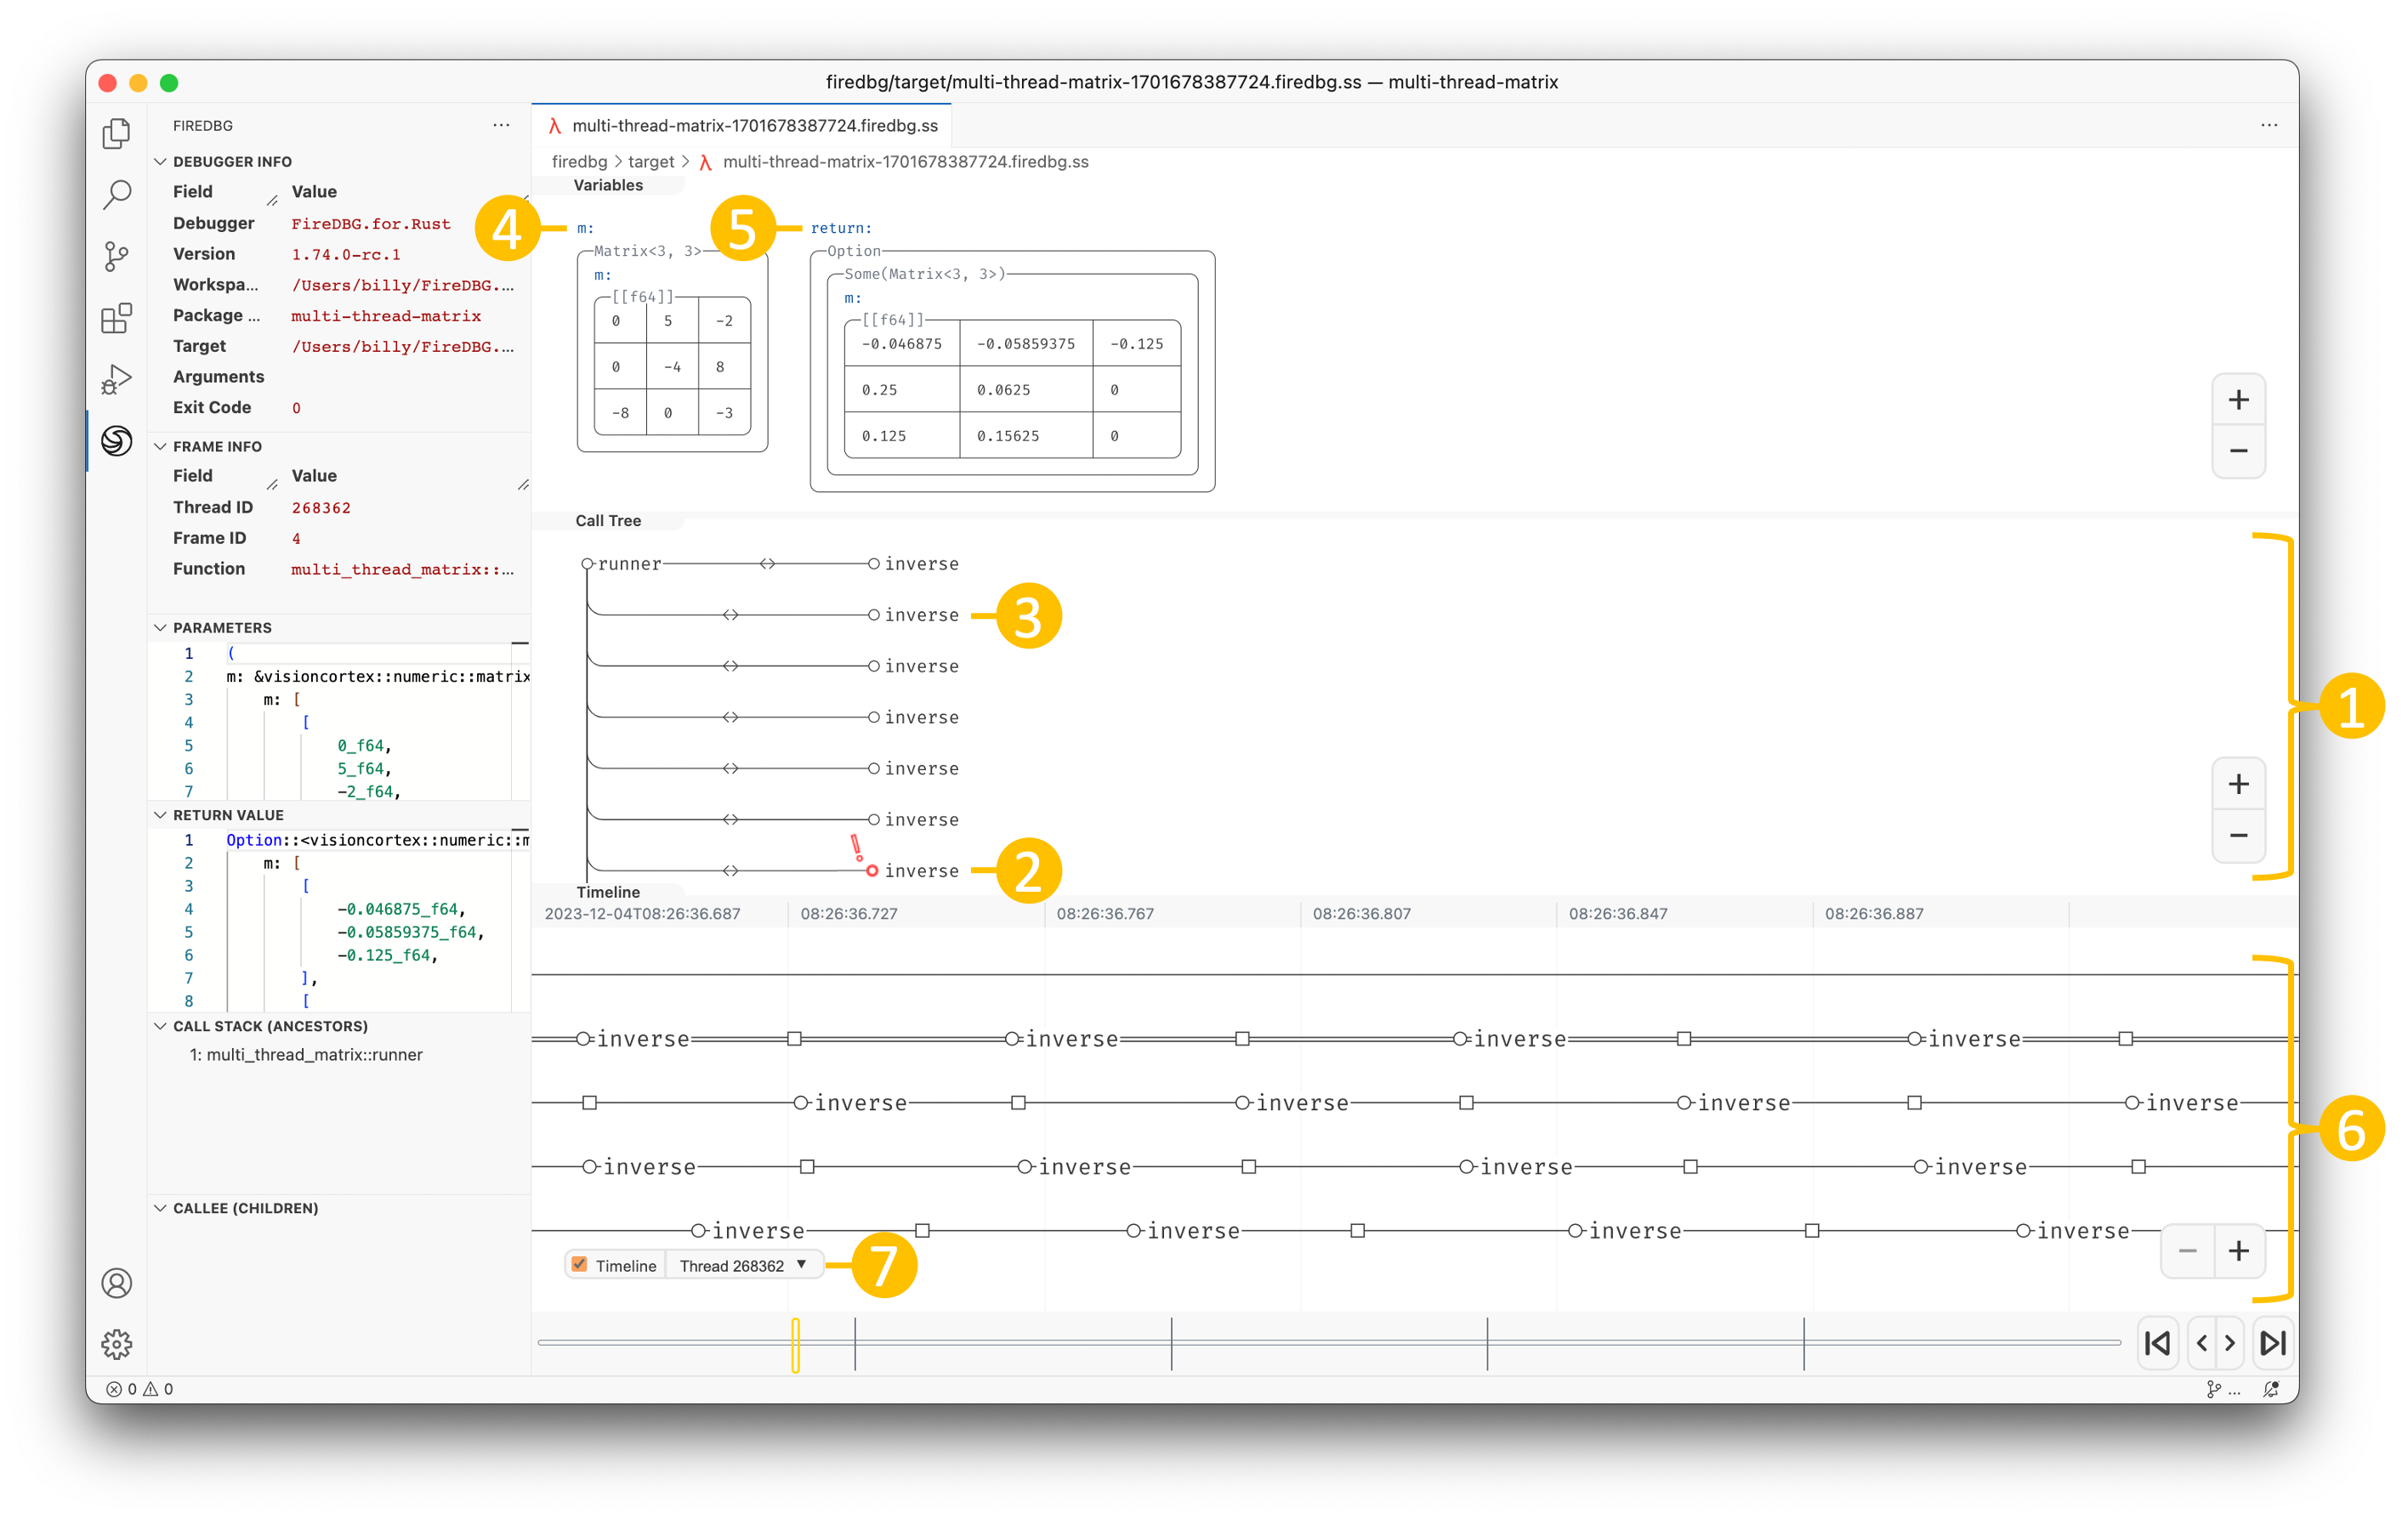
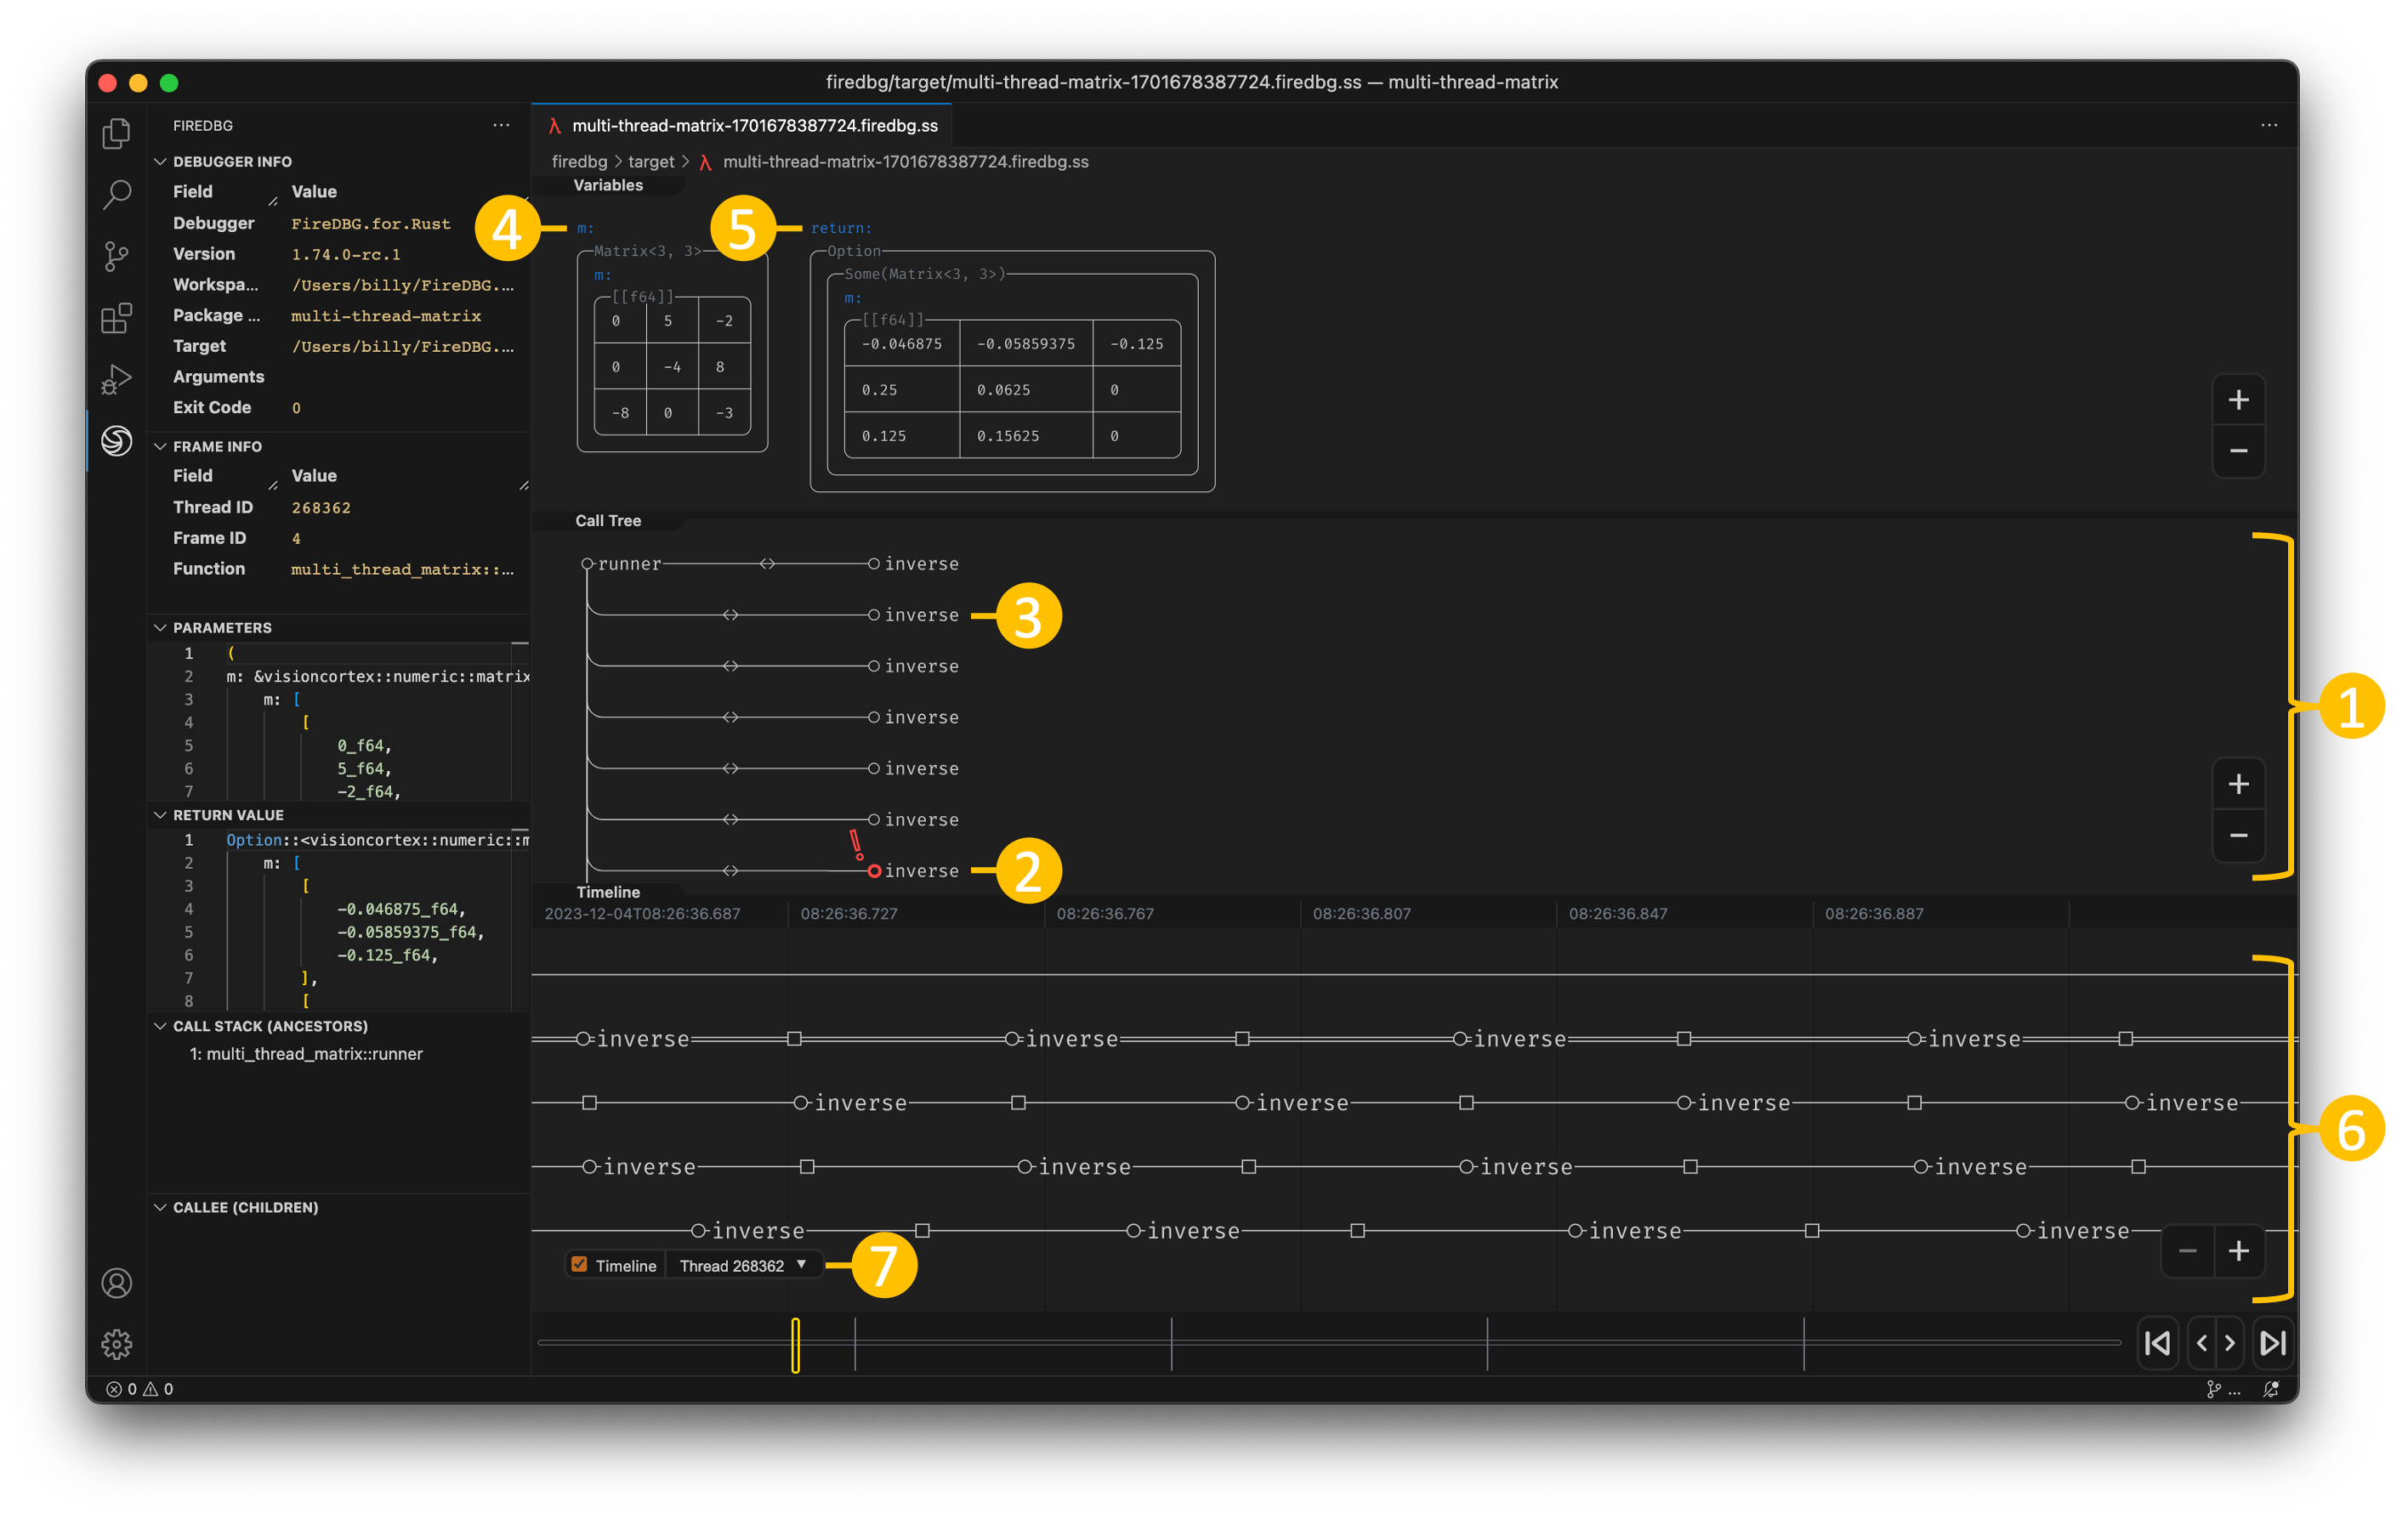
How to interpret and inspect visualized call tree, variables, timeline and threads in the Extension?
We can the open the debugger view by clicking the items in the FIREDBG RUNS panel, or with the open command:
firedbg open
- Each node represent a function call; the depth of each node indicates the depth of the call stack; each node has a unique frame ID; there are two types of edge:
- Function call with return value:
-<->- - Function call only:
-->--
- Function call with return value:
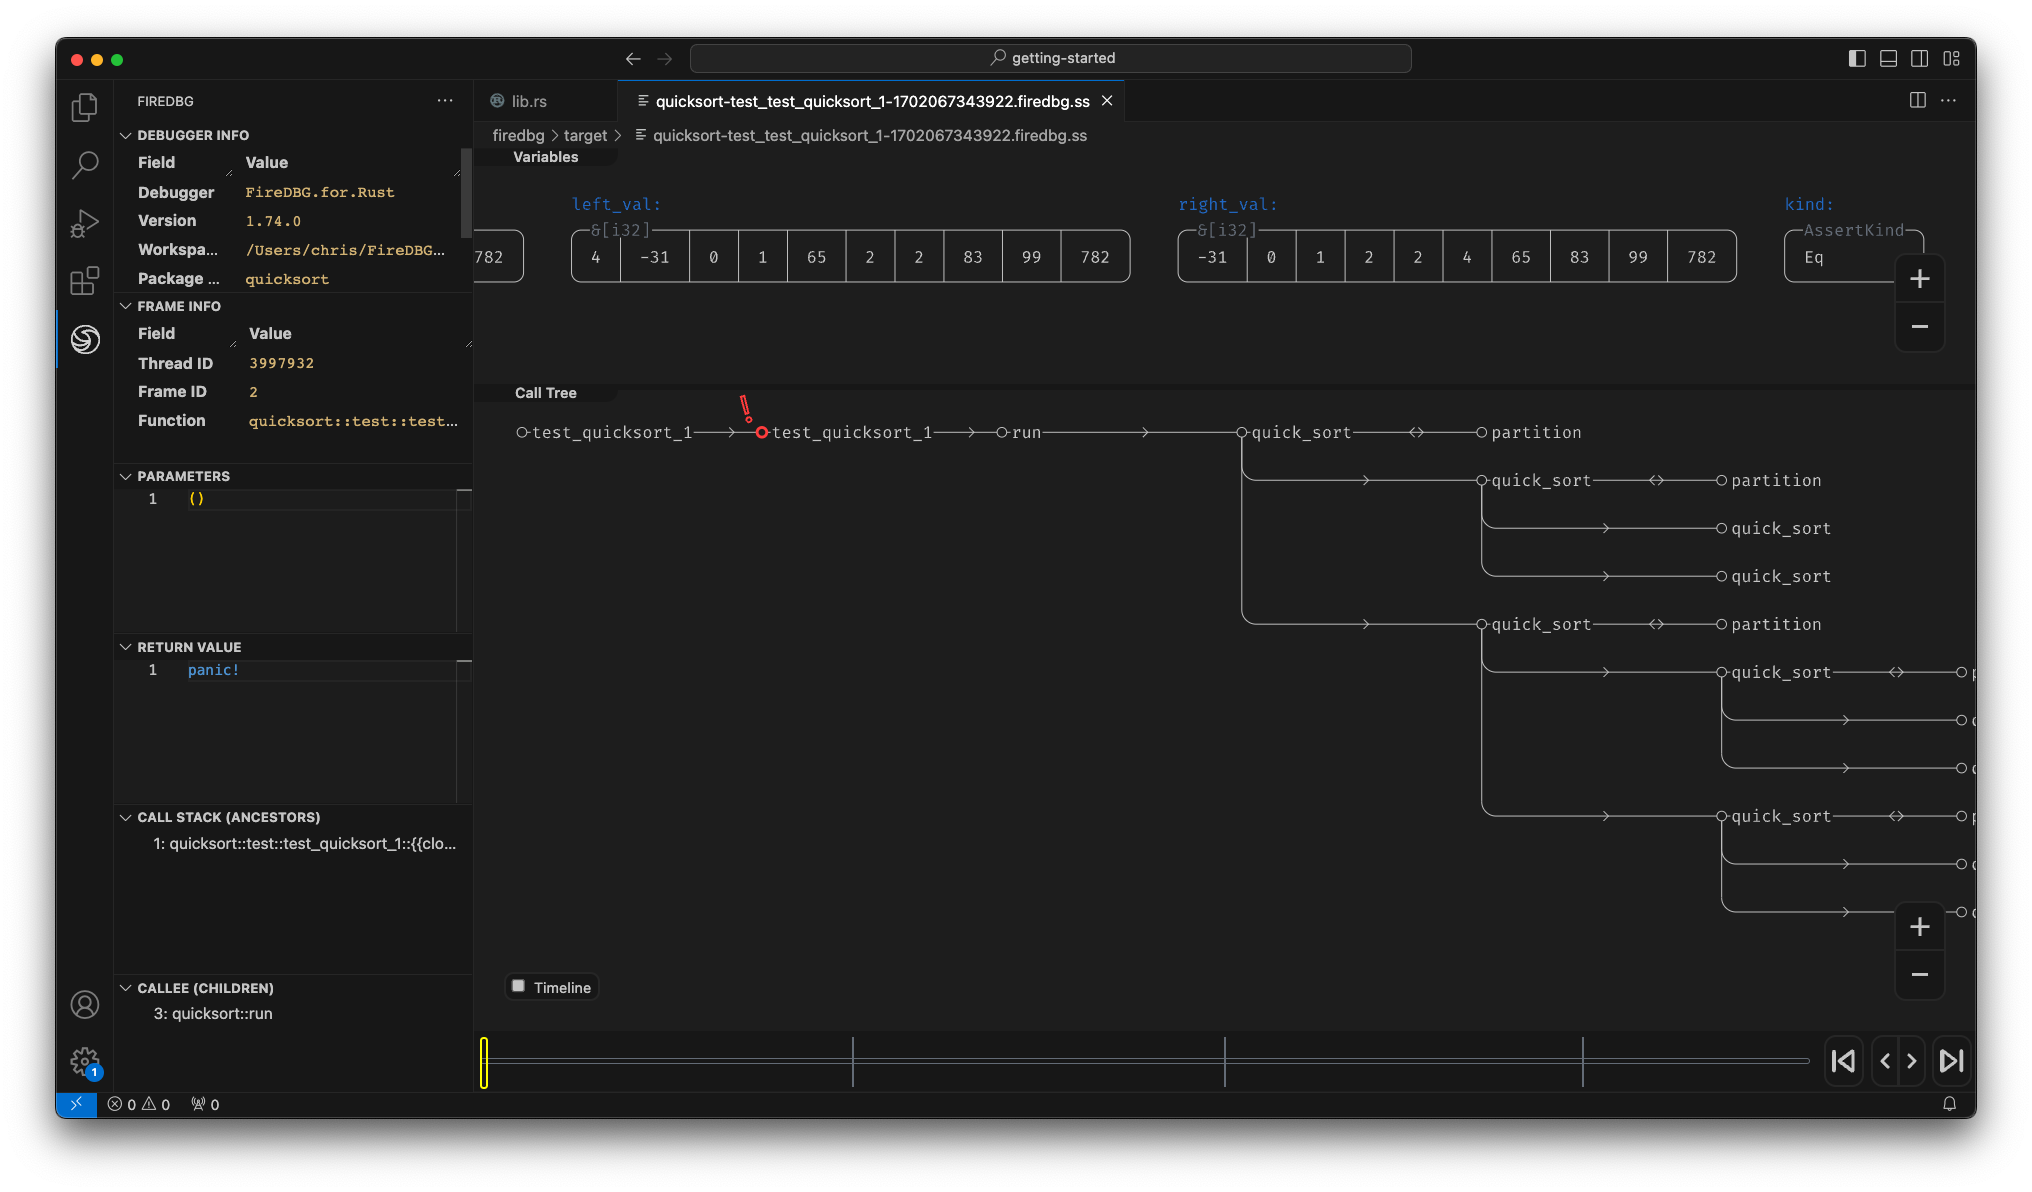
- If the program exited with a panic, the panicking function will be highlighted in red with an exclamation mark.
- Click on the function name on the call tree node to reveal the Rust source code.
- Function Arguments: the name of the argument is shown as the label. The faded text on the bounding box denote the type name, where hovering on it will reveal the fully-qualified name. The actual value is enclosed in the bounding box.
- Function Return Value: the return value will be shown on the far right with the label
return. - Timeline: toggle the timline by checking the timeline checkbox on the bottom. There are two kinds of node:
- Circle: function call
- Square: function return
- Thread selector: If the program has more than one thread, a dropdown will be shown on the bottom. You can switch to inspect the execution of other threads. Bring up the timeline to view the execution of all threads in a single view.
Controls
How to navigate the program execution flow?
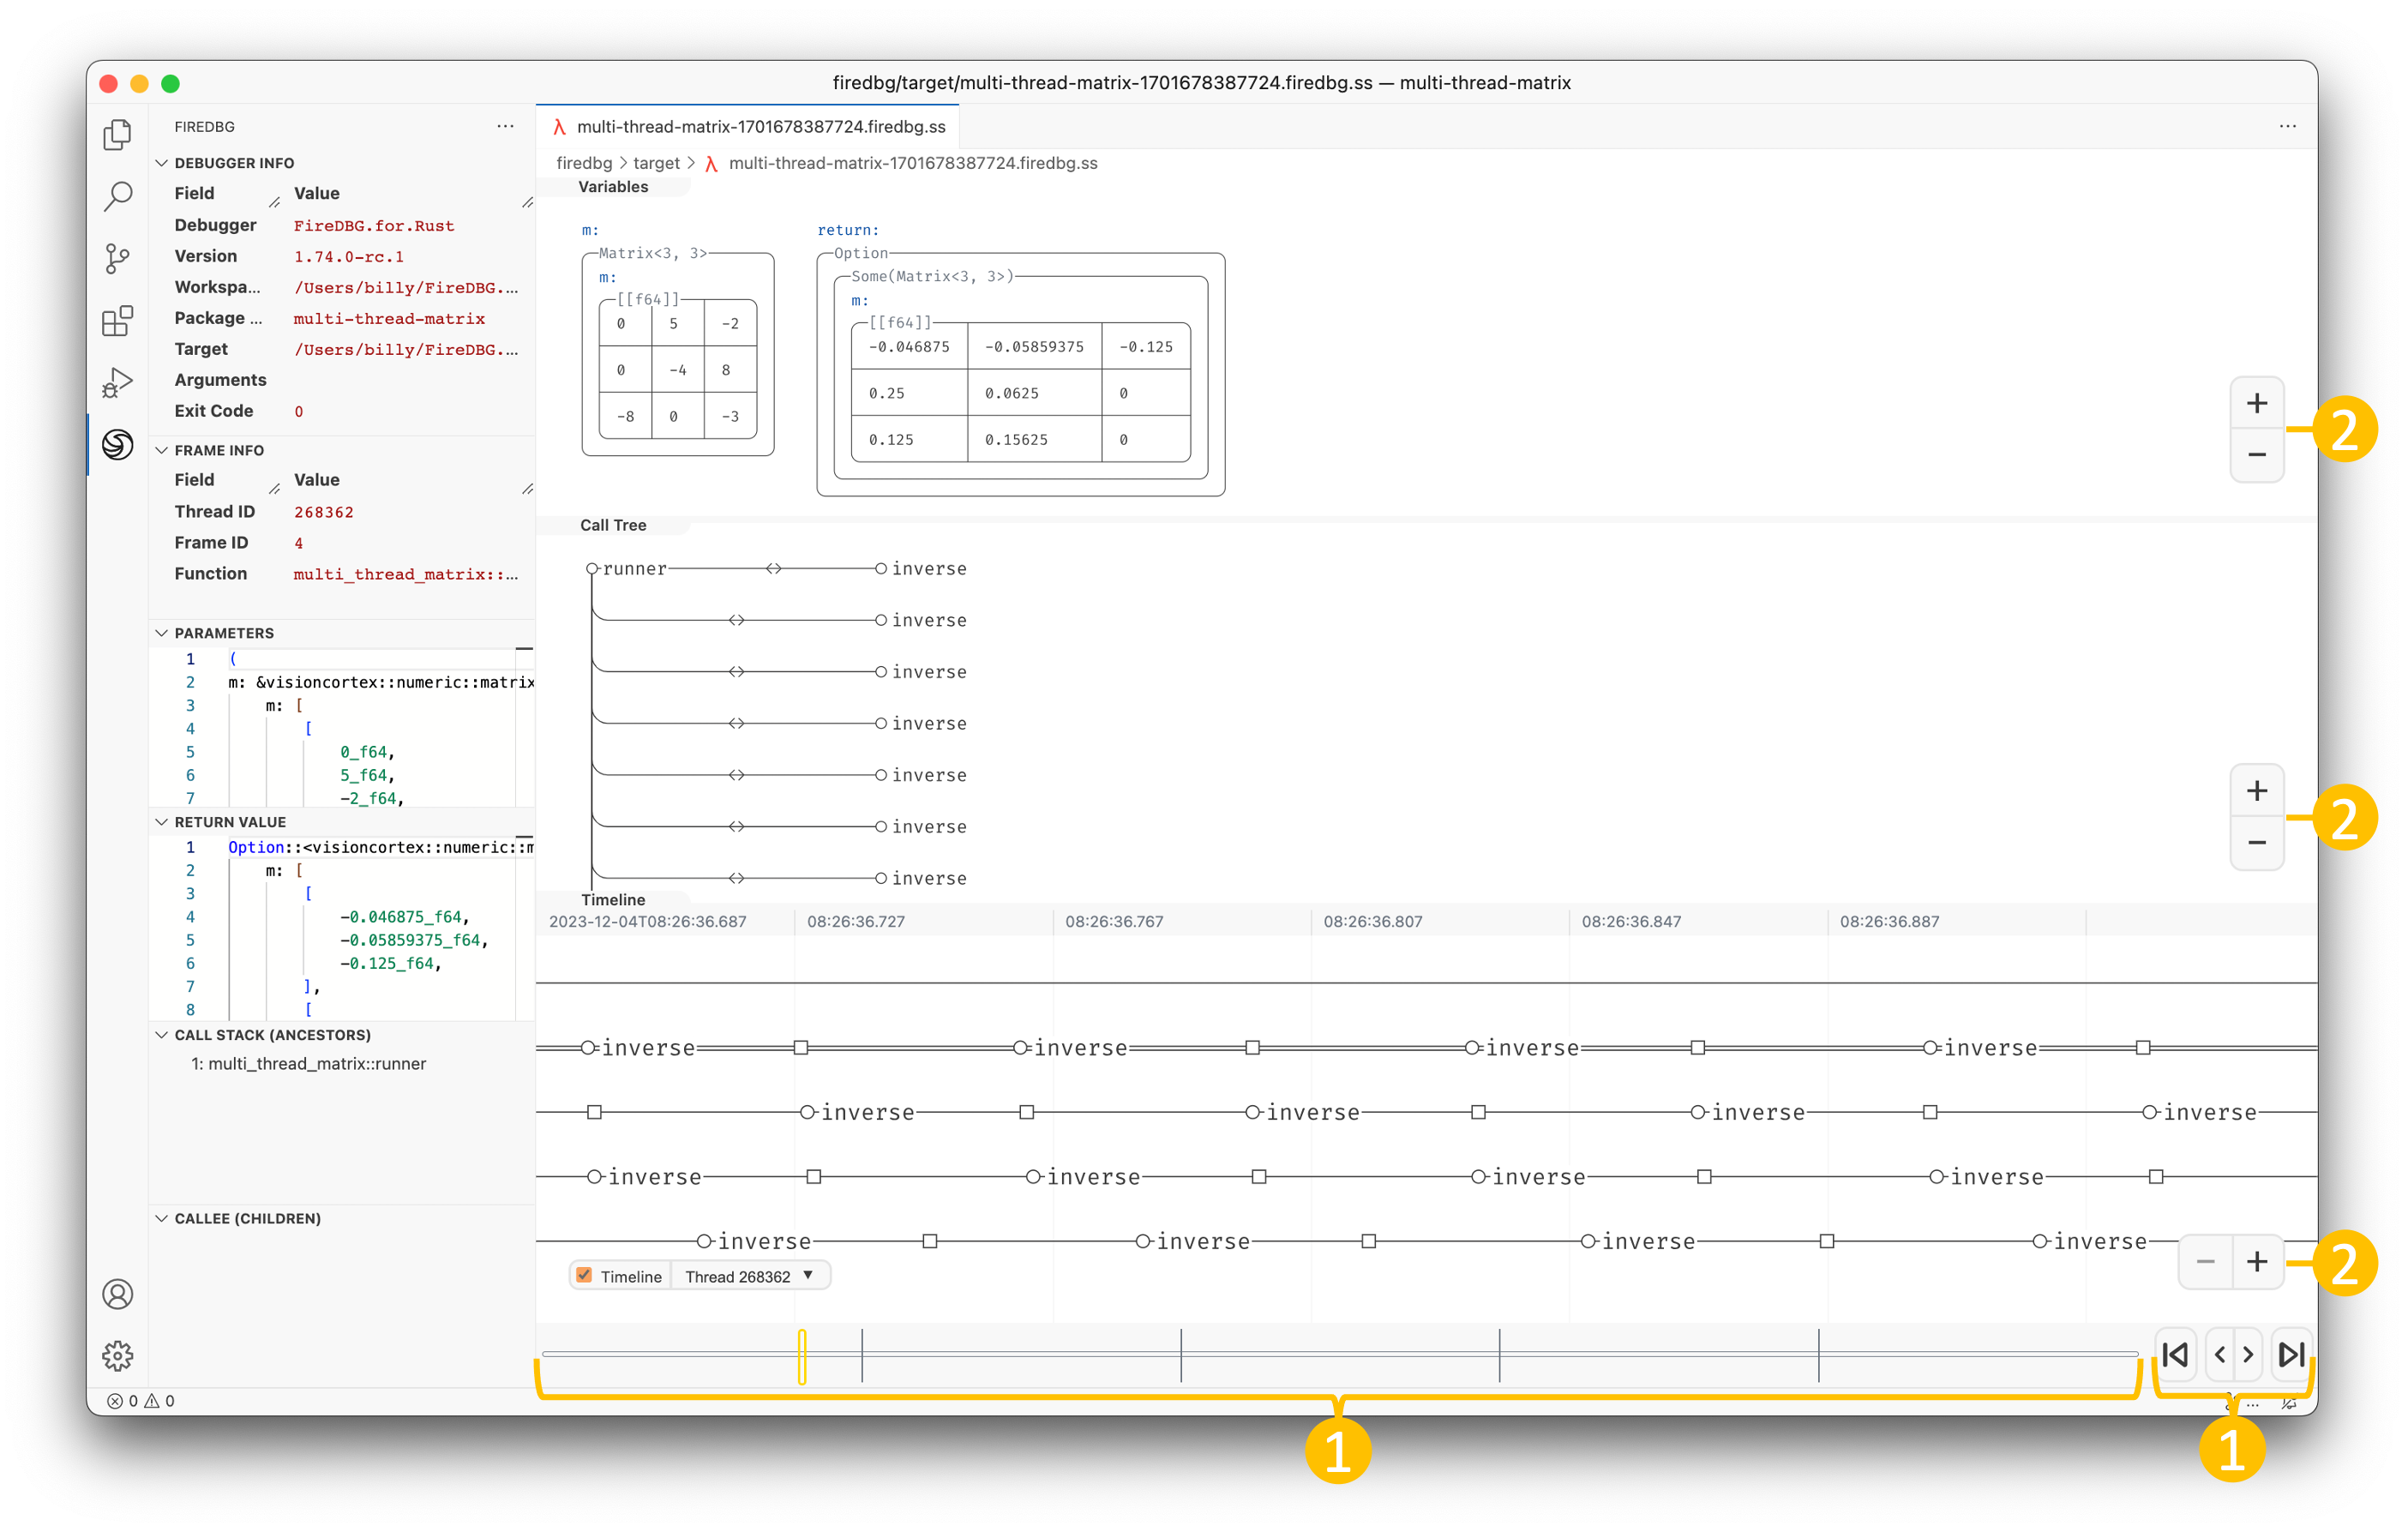
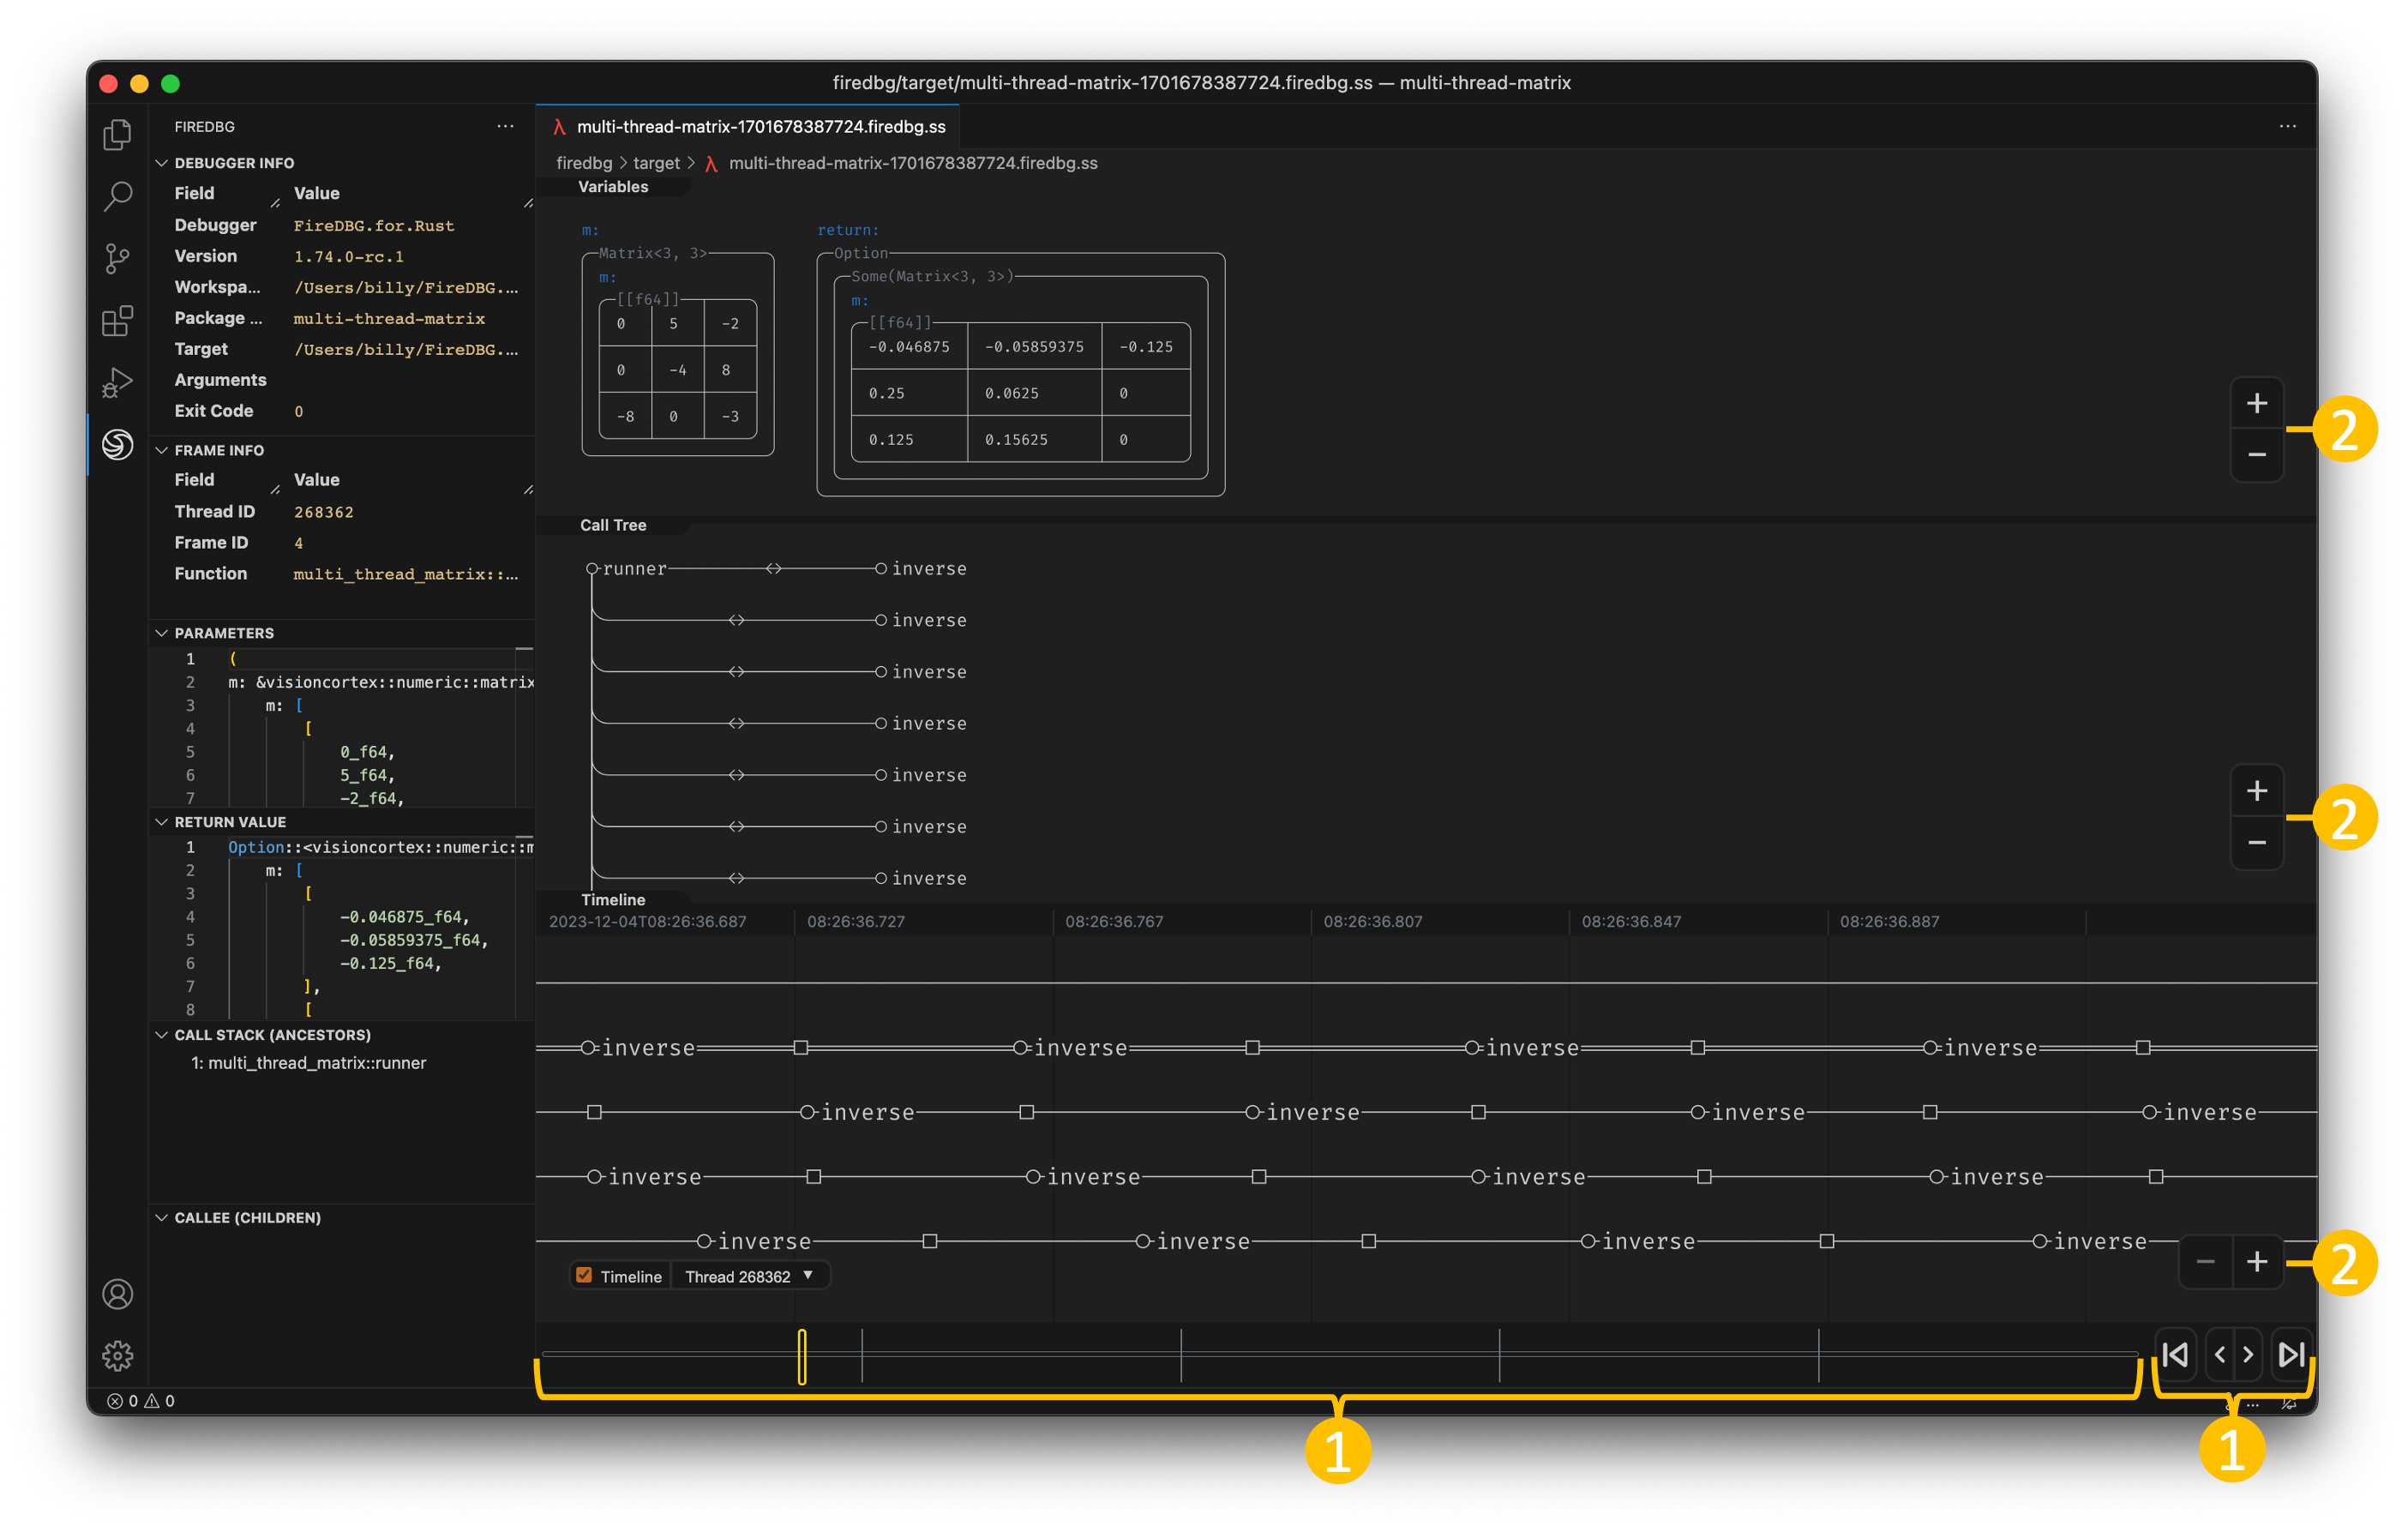
- Use the control buttons on the timebar to jump to the beginning or the end of program execution. Use
JKon your keyboard or stepping buttons<>to step one frame backward or forward. The unit of time on the timebar is frame ID of the selected thread. Clicking on the timebar would jump to the exact function call. - The visualization will be updated as you traverse the call tree. Use
WASDkeys on your keyboard or your left mouse click to pan; Click the+|-buttons on the bottom right or-=on your keyboard or use your mouse scroll wheel to zoom.
To resize a panel, hover the mouse on the panel gutter then drag to resize. Tip: double clicking the gutter reverts the panel to a pre-defined size.
FireDBG Sidebar
How to retrieve detailed debug info?
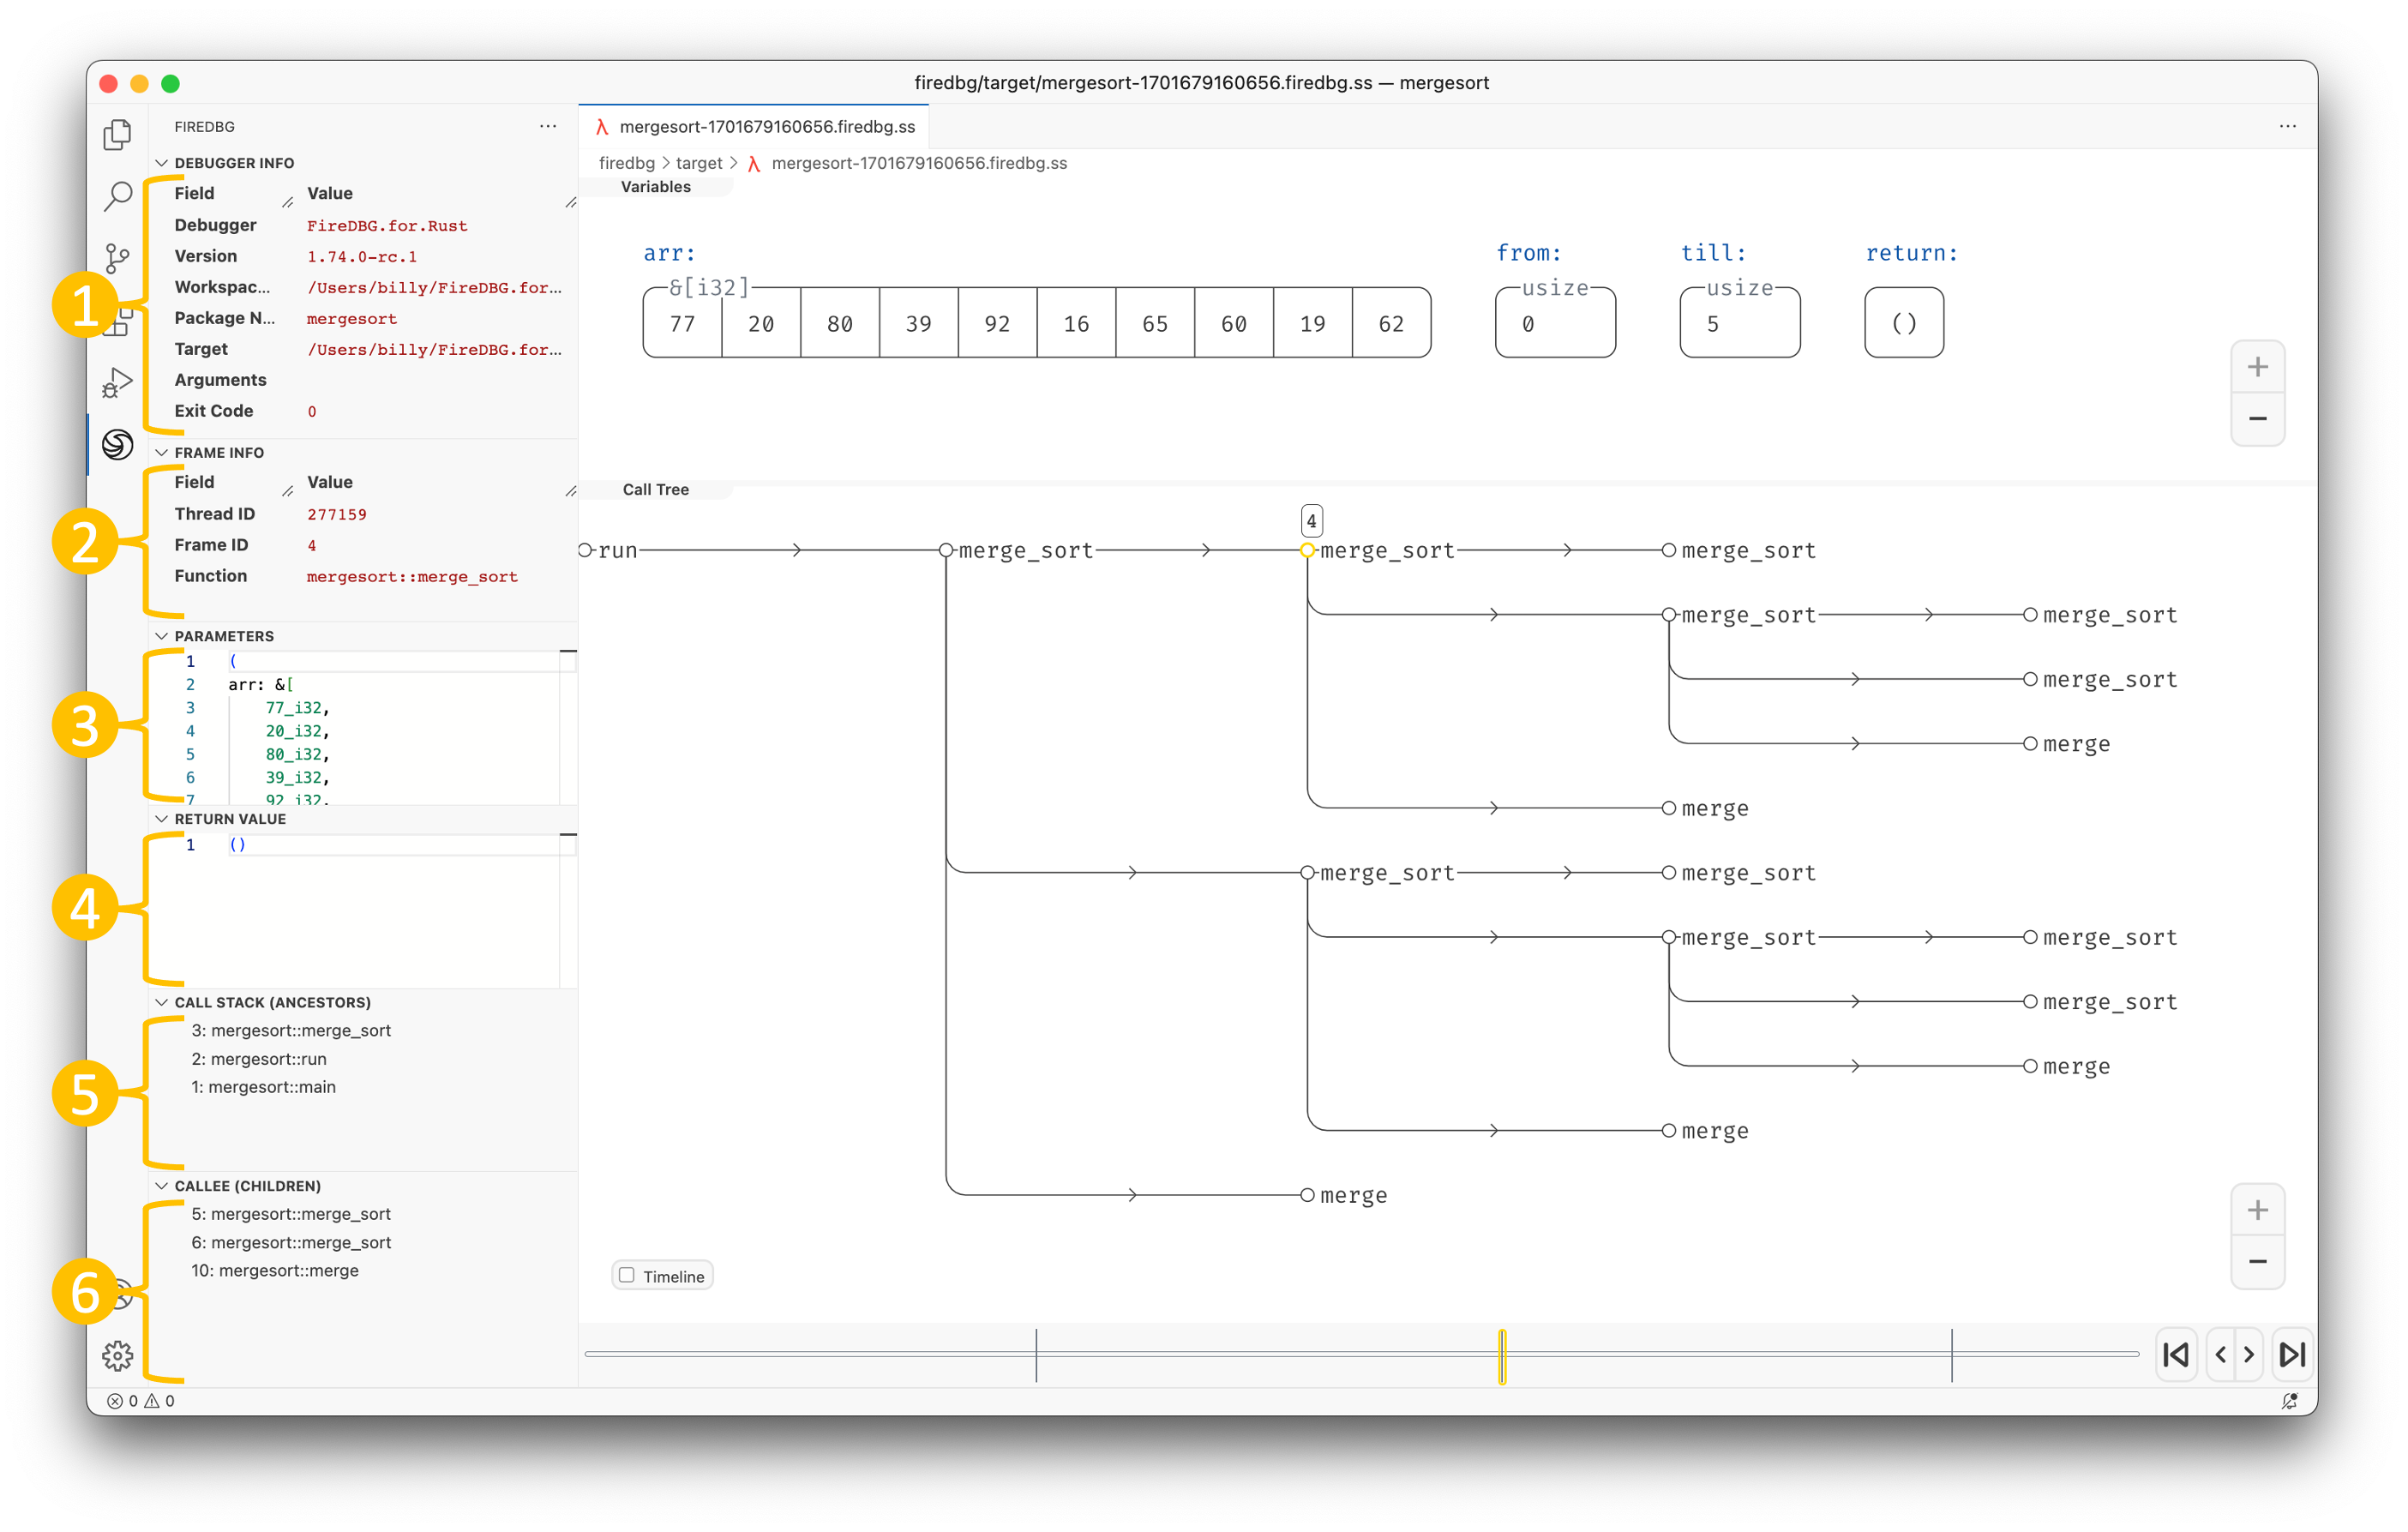
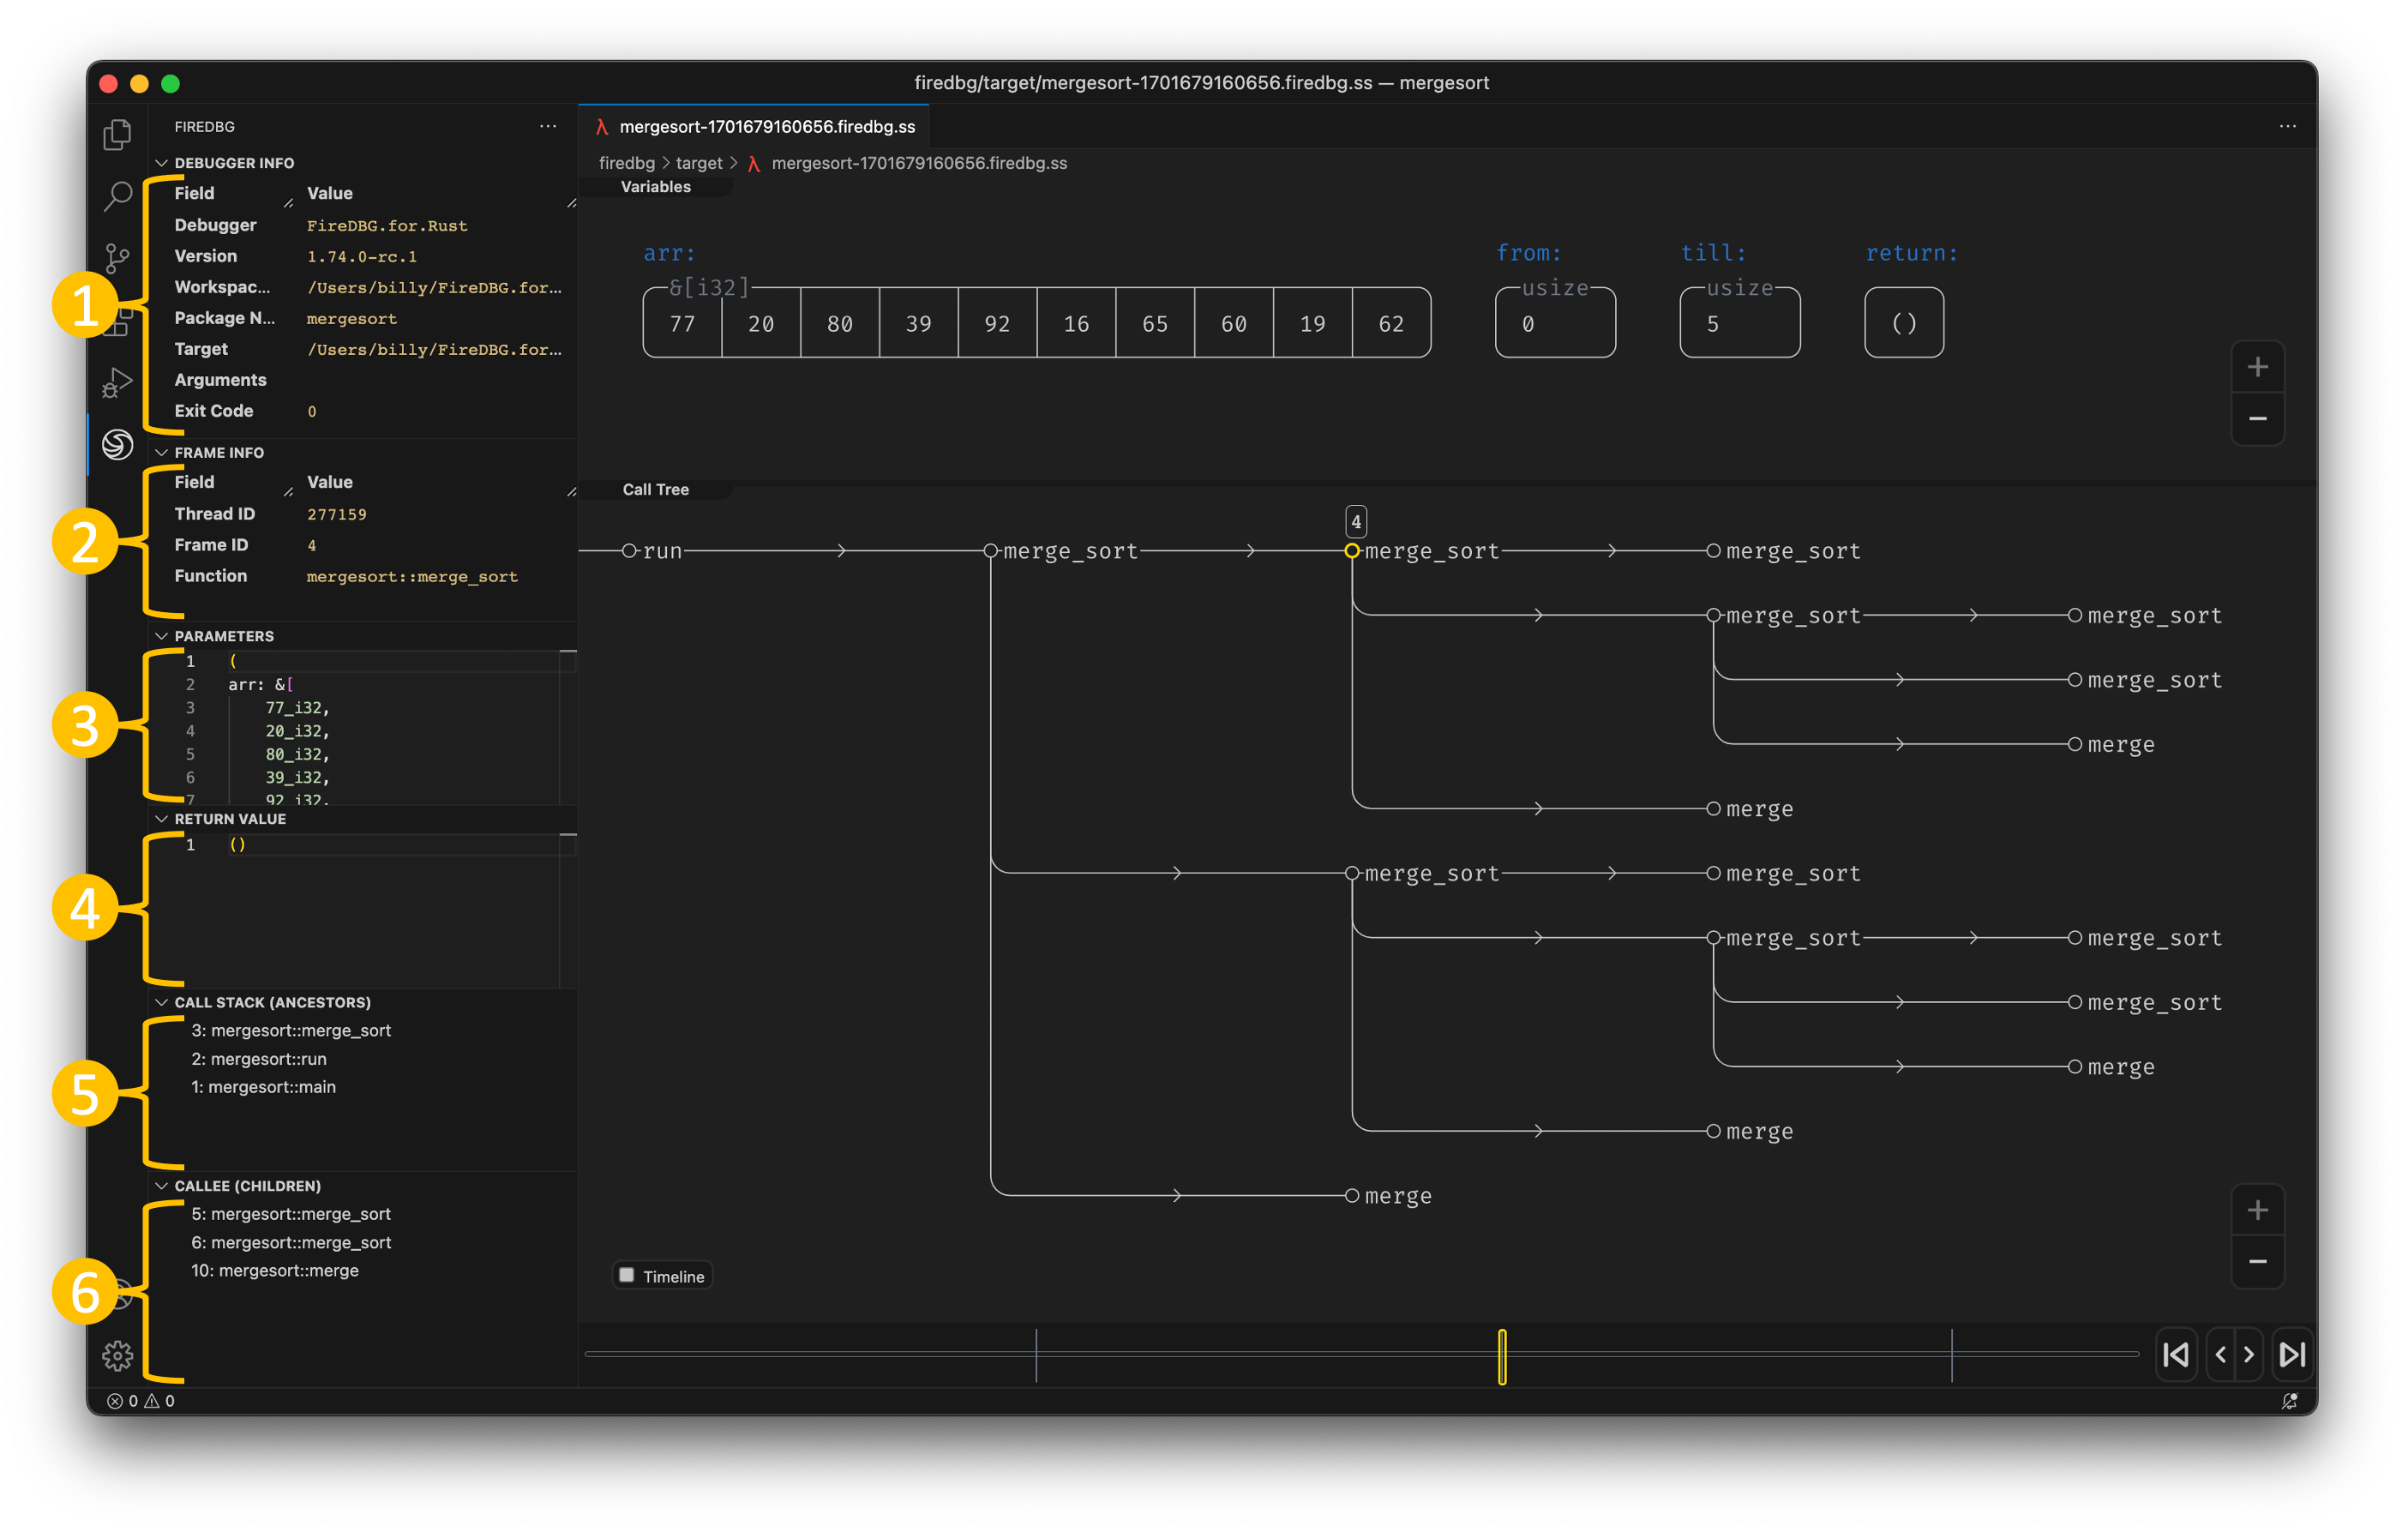
The FireDBG sidebar contains all debug info. It will be updated as you traverse the call tree.
Debugger Info: FireDBG debugger info, program executable info and runtime infoFrame Info: frame metadata of the inspected function callParameters: Rust-like representation of the inspected function call's argumentsReturn Value: Rust-like representation of the inspected function's return valueCall Stack (Ancestors): ancestors of the inspected function; up until rootCallee (Children): immediate children of the inspected function
FireDBG CLI
There are two ways to tell firedbg where is the root directory of a cargo workspace:
- By default, the current directory will be the root directory of a cargo workspace
- Or, overriding it with
--workspace-rootoption, i.e.firedbg --workspace-root <WORKSPACE-ROOT>
Some common sub-commands include:
cache: Parse all.rssource files in the current workspaceclean: Cleanup thefiredbg/folderlist-target: List all runnable targetsrun: Run a binary target with debugging enabledexample: Run an example with debugging enabledtest: Run an integrated test with debugging enabledunit-test: Run a unit test with debugging enabledindex: Run indexer on the latest run and save it as a.sqlitedb filelist-run: List allfiredbgrunsopen: Open debugger view in VS Codehelp: Print help message or the help of the given subcommand(s)
You can get the help messages by appending the --help flag.
FireDBG Workspace
Cargo workspace is a set of crates sharing the same Cargo.lock and target directory.
FireDBG rely on Cargo to locate source files and targets for debugging.
Now you have a basic understanding on the usage of FireDBG. Let's create a Cargo workspace and practice debugging with FireDBG!
Full source code is available on our testbench.
Start by creating a getting-started workspace.
$ mkdir getting-started
$ cd getting-started
For now, we only have a single quicksort package in this workspace. We will add one more crate later.
[workspace]
members = ["quicksort"]
To create the quicksort library, we can use the convenient cargo command.
$ cargo new --lib quicksort
$ cd quicksort
Debugging Unit Tests
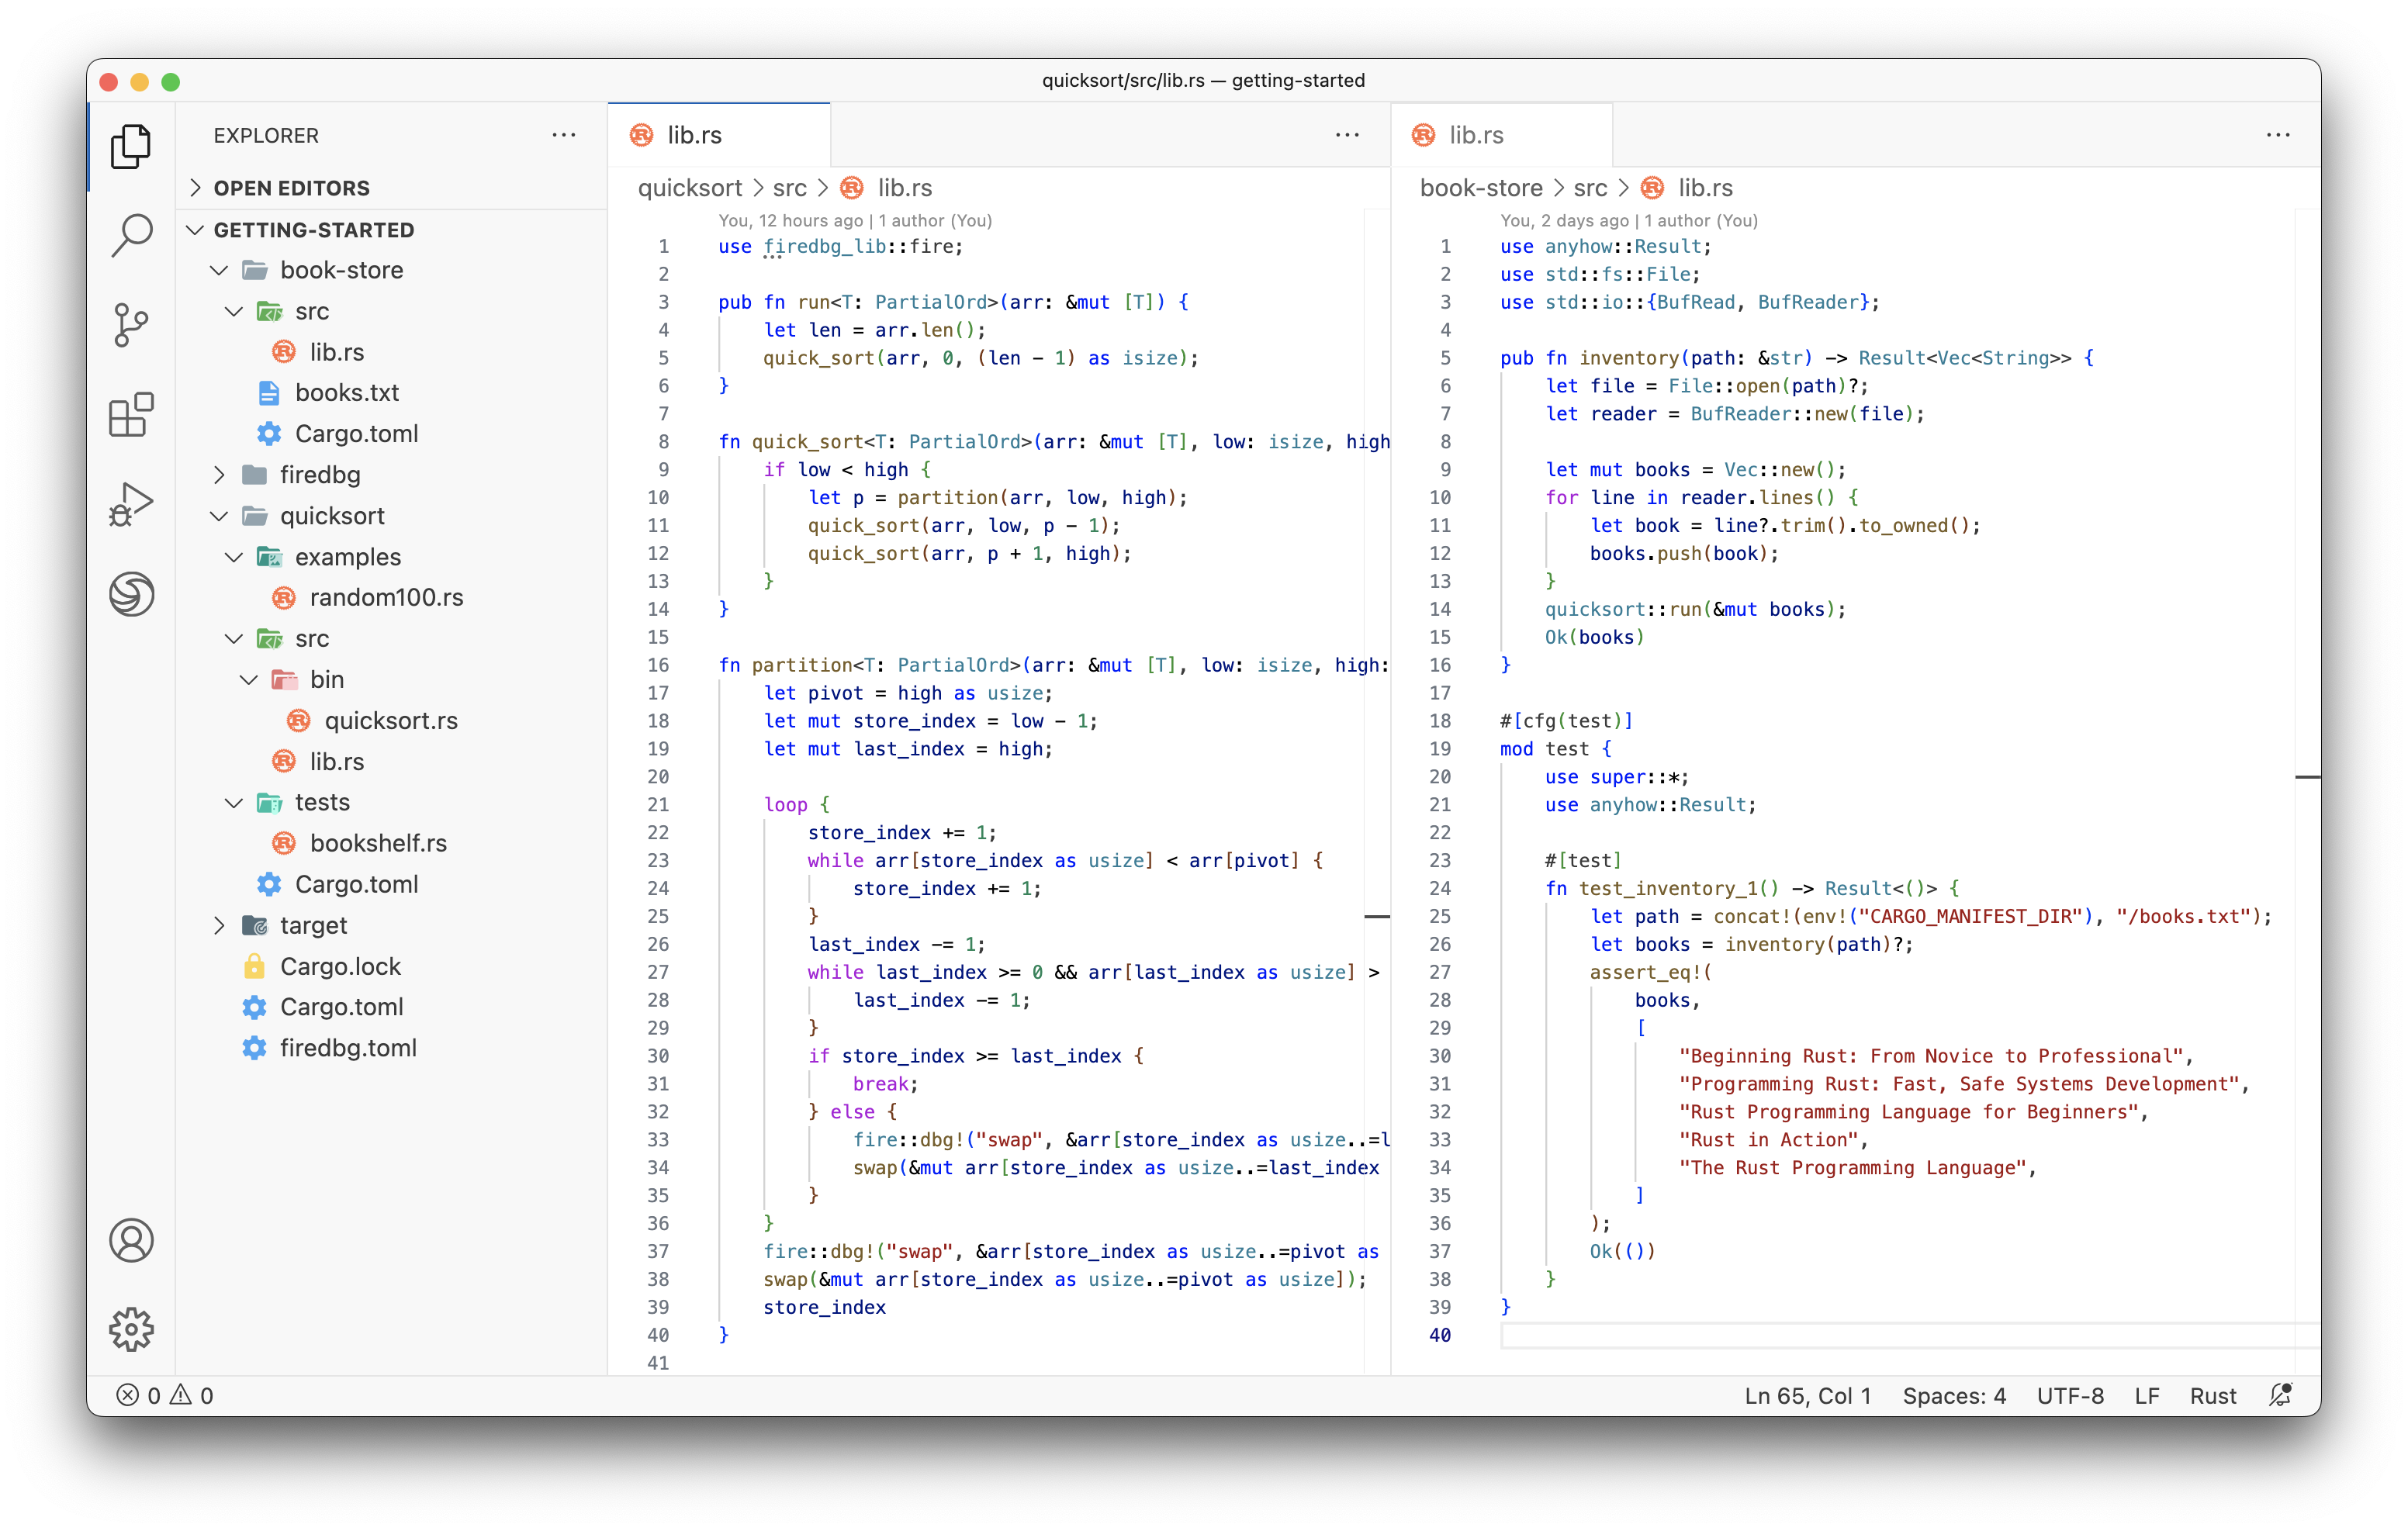
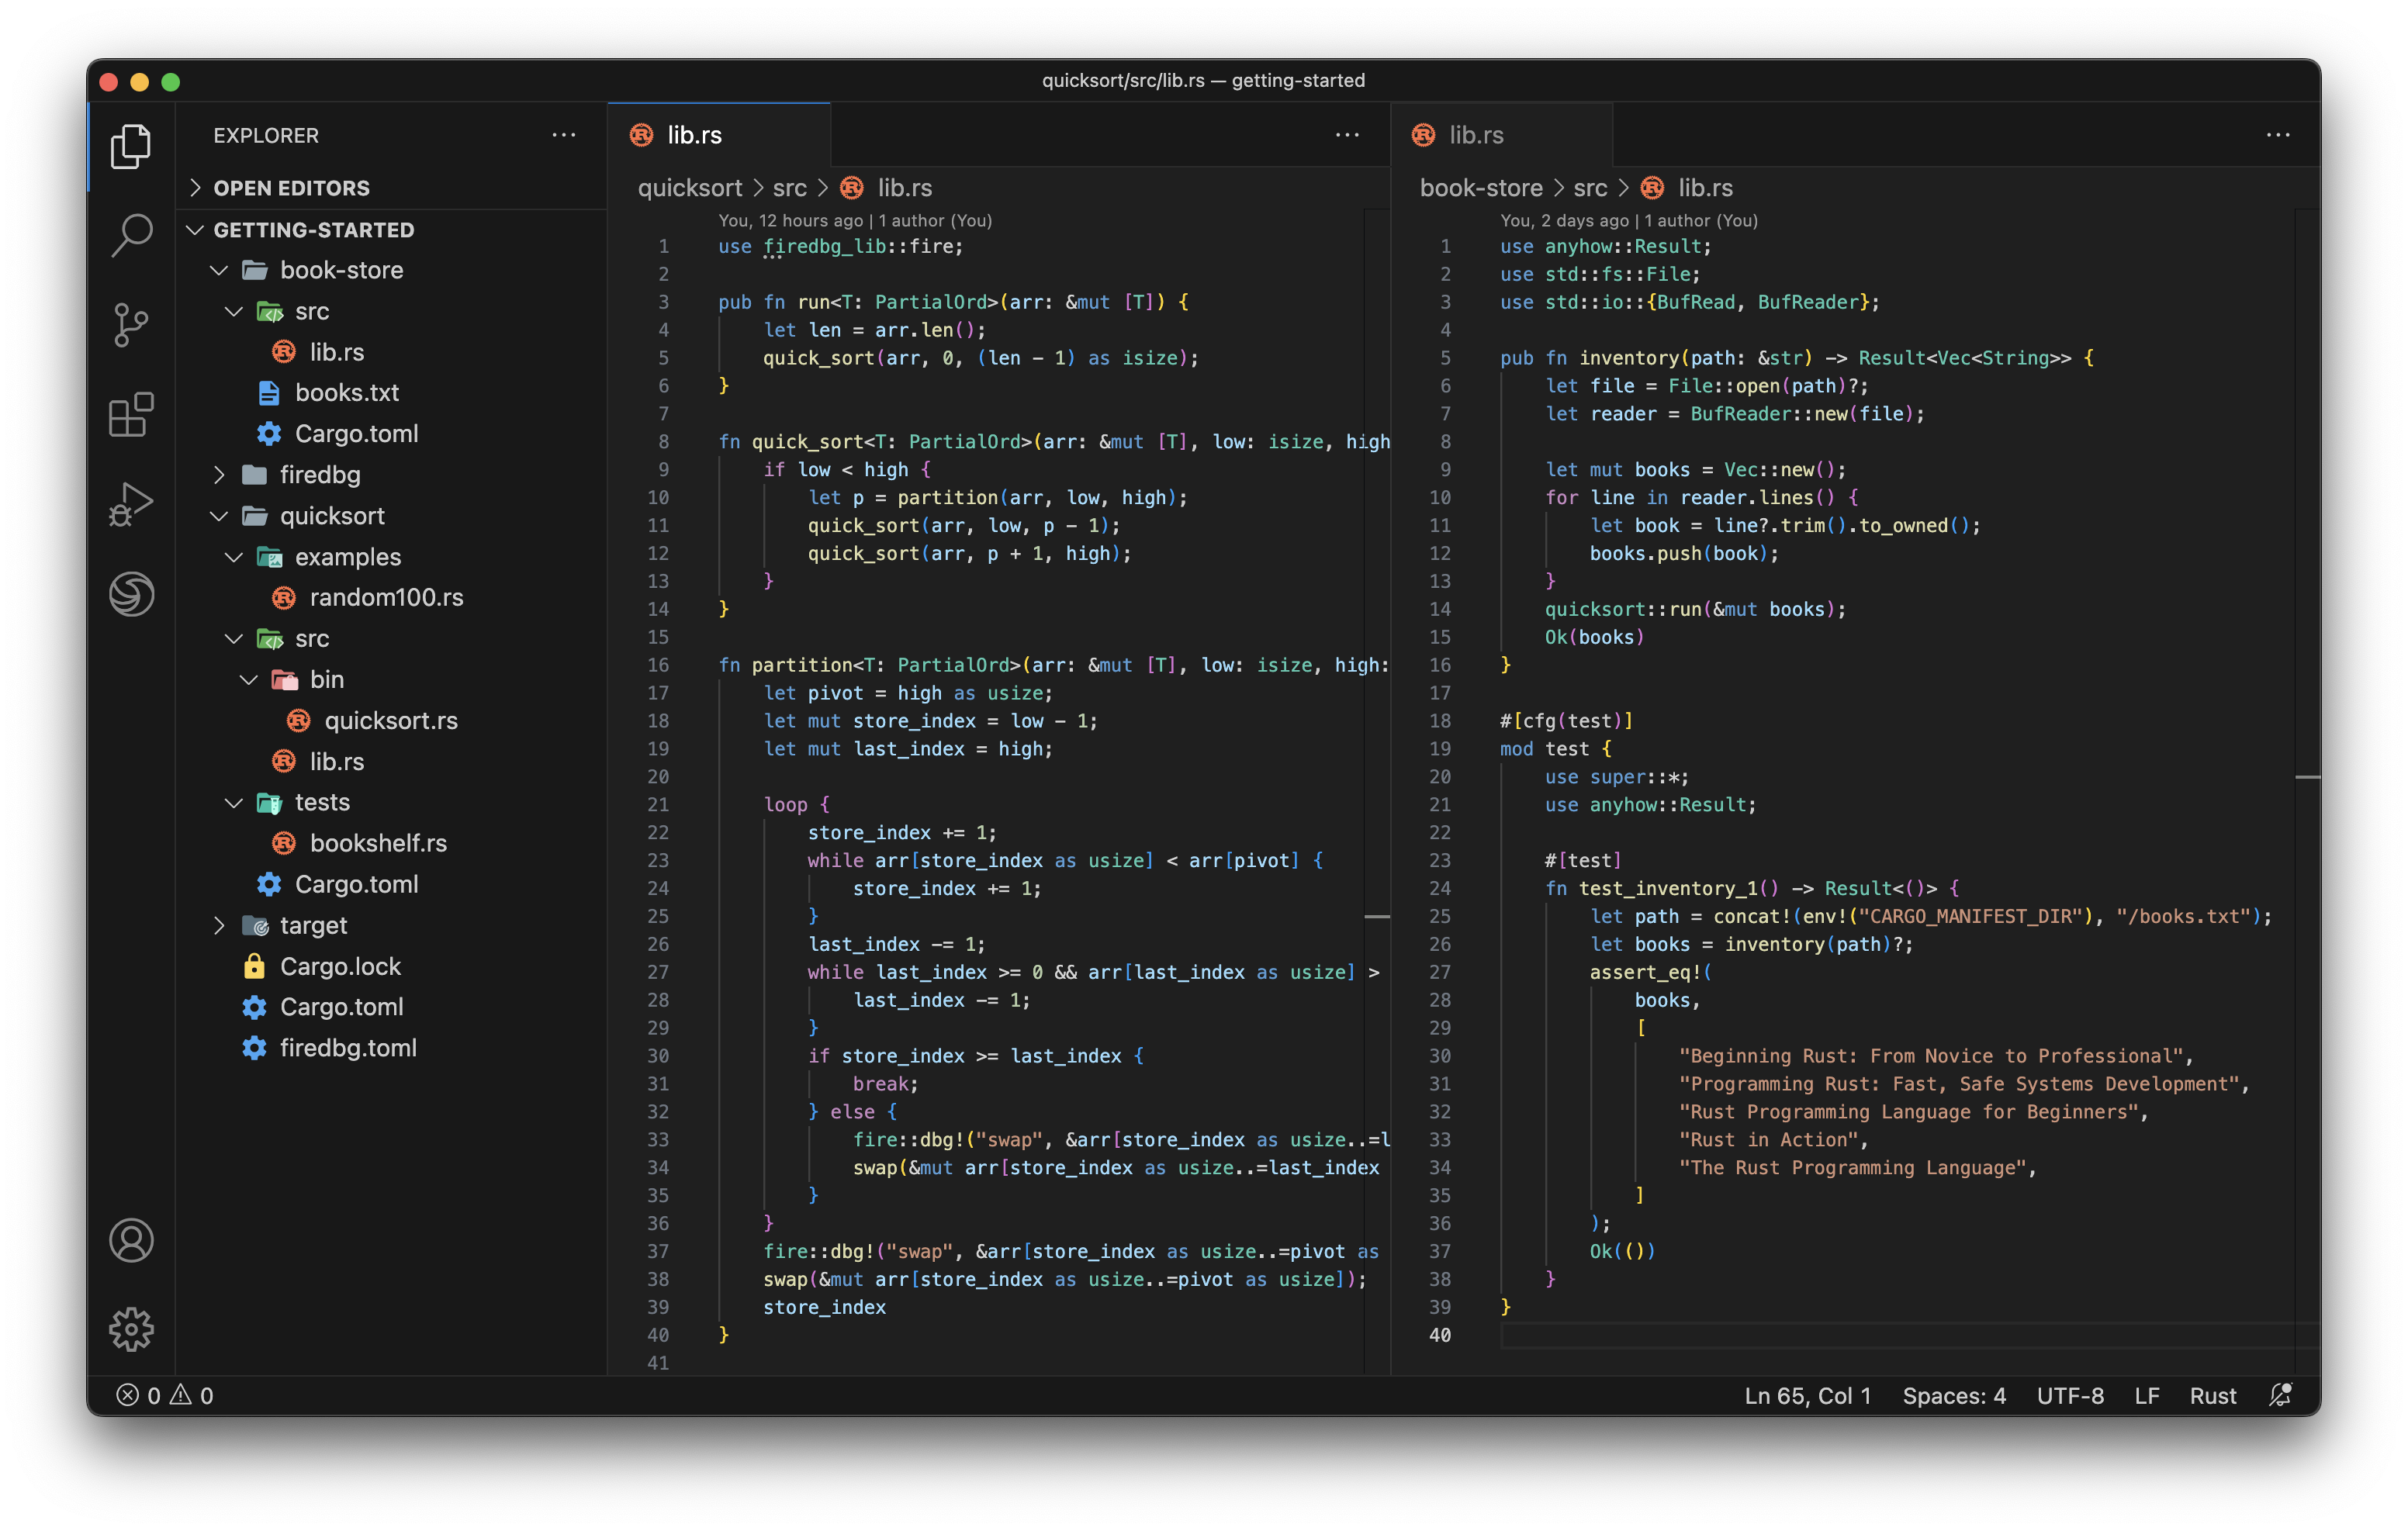
Replace the content of lib.rs with our "faulty" quick sort library code.
pub fn run<T: PartialOrd>(arr: &mut [T]) {
    let len = arr.len();
    quick_sort(arr, 0, (len - 1) as isize);
}

fn quick_sort<T: PartialOrd>(arr: &mut [T], low: isize, high: isize) {
    if low < high {
        let p = partition(arr, low, high);
        quick_sort(arr, low, p - 1);
        quick_sort(arr, p + 1, high);
    }
}

fn partition<T: PartialOrd>(arr: &mut [T], low: isize, high: isize) -> isize {
    let pivot = high as usize;
    let mut store_index = low; // Shouldn't this be `low - 1`?
    let mut last_index = high;

    loop {
        store_index += 1;
        while arr[store_index as usize] < arr[pivot] {
            store_index += 1;
        }
        last_index -= 1;
        while last_index >= 0 && arr[last_index as usize] > arr[pivot] {
            last_index -= 1;
        }
        if store_index >= last_index {
            break;
        } else {
            arr.swap(store_index as usize, last_index as usize);
        }
    }
    arr.swap(store_index as usize, pivot as usize);
    store_index
}
Then add some unit tests to the end of lib.rs file.
#[cfg(test)]
mod test {
    use super::*;

    #[test]
    fn test_quicksort_1() {
        let mut numbers = [4, 65, 2, -31, 0, 99, 2, 83, 782, 1];
        run(&mut numbers);
        assert_eq!(numbers, [-31, 0, 1, 2, 2, 4, 65, 83, 99, 782]);
    }

    #[test]
    fn test_quicksort_2() {
        let mut numbers = [1, 2, 2];
        run(&mut numbers);
        assert_eq!(numbers, [1, 2, 2]);
    }
}
Click on the debug icon on the left to start debugging the unit test. Or with the CLI:
firedbg unit-test quicksort test::test_quicksort_1
Oooops... assertion failure!
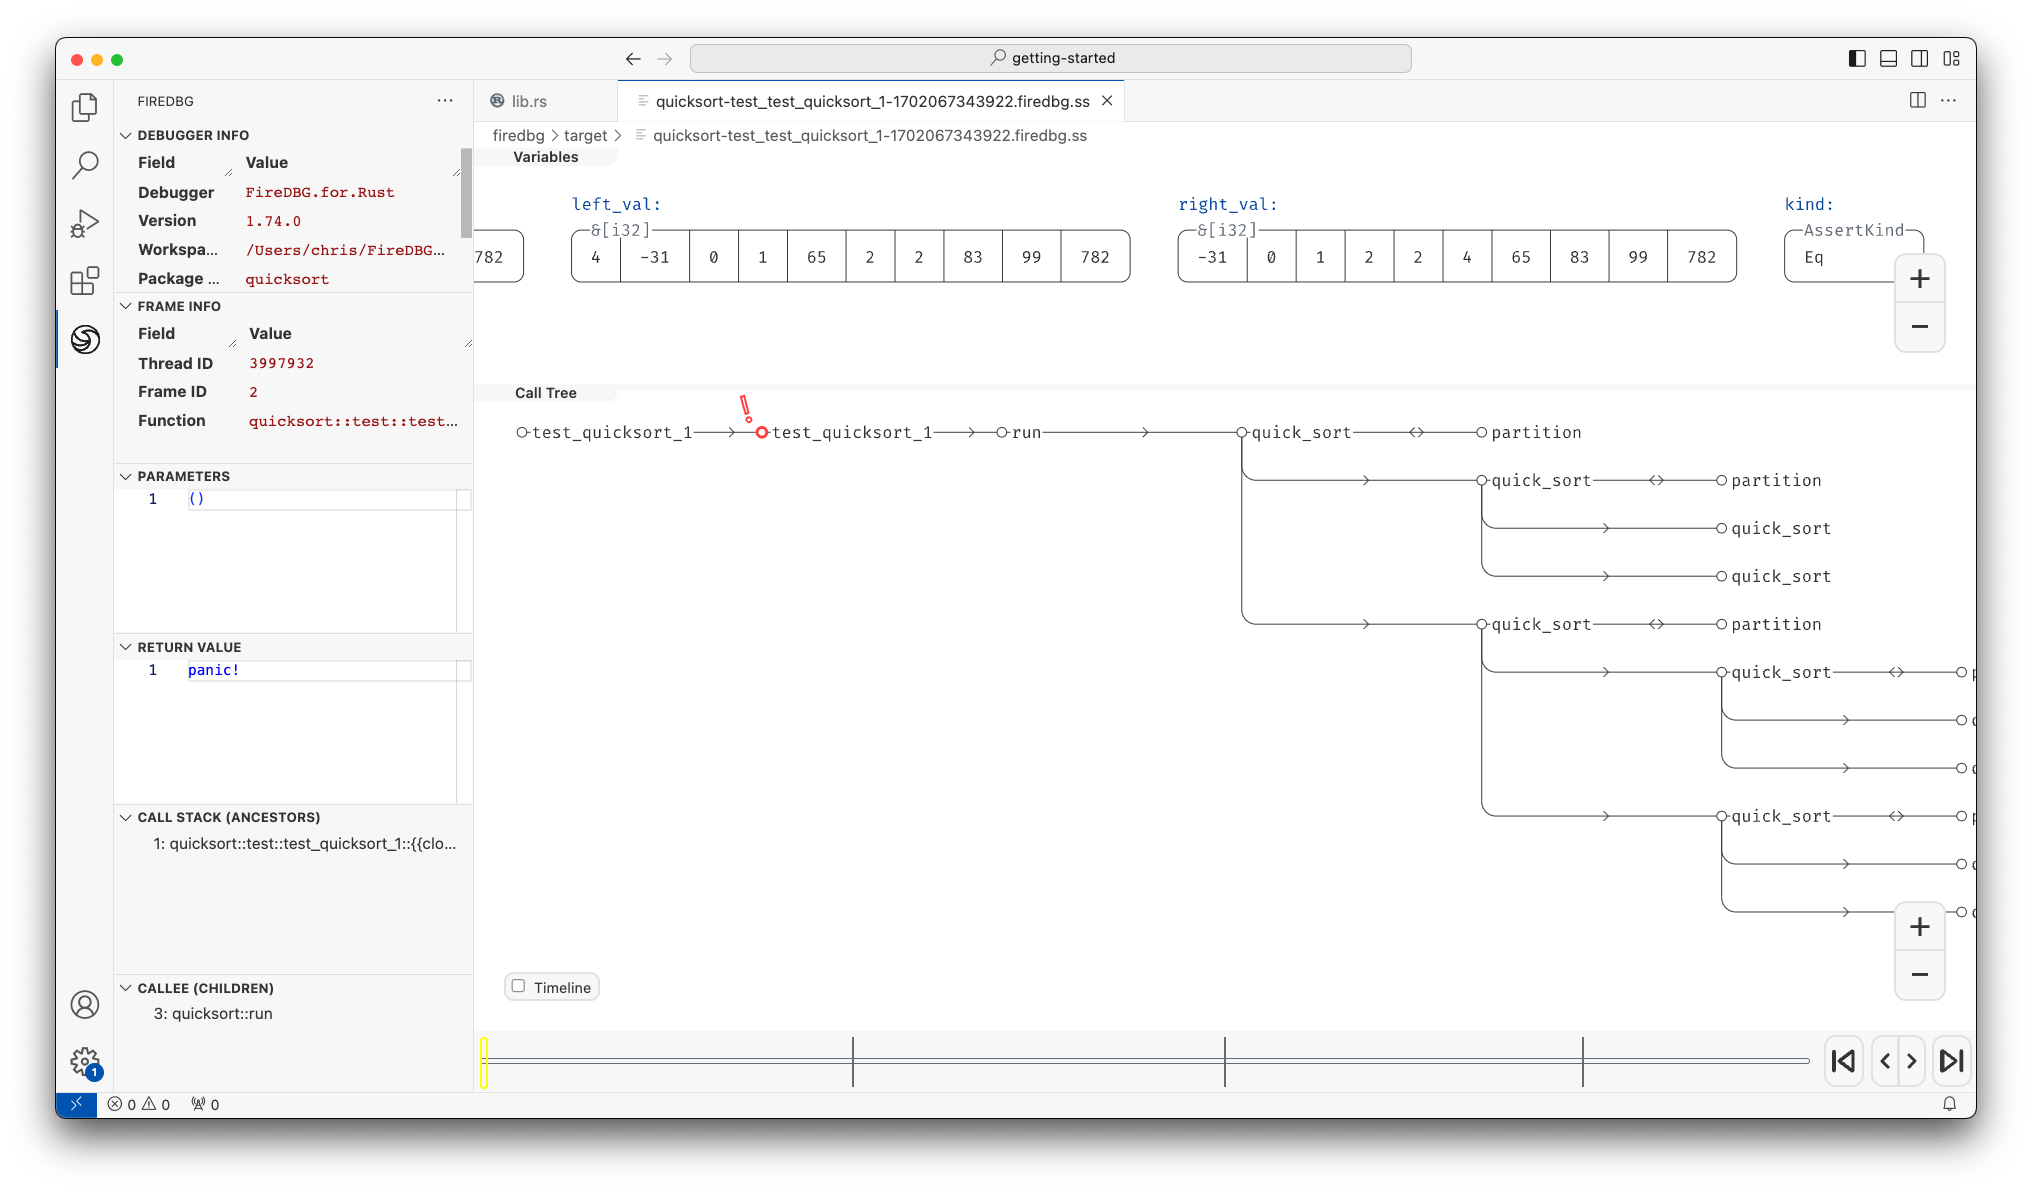
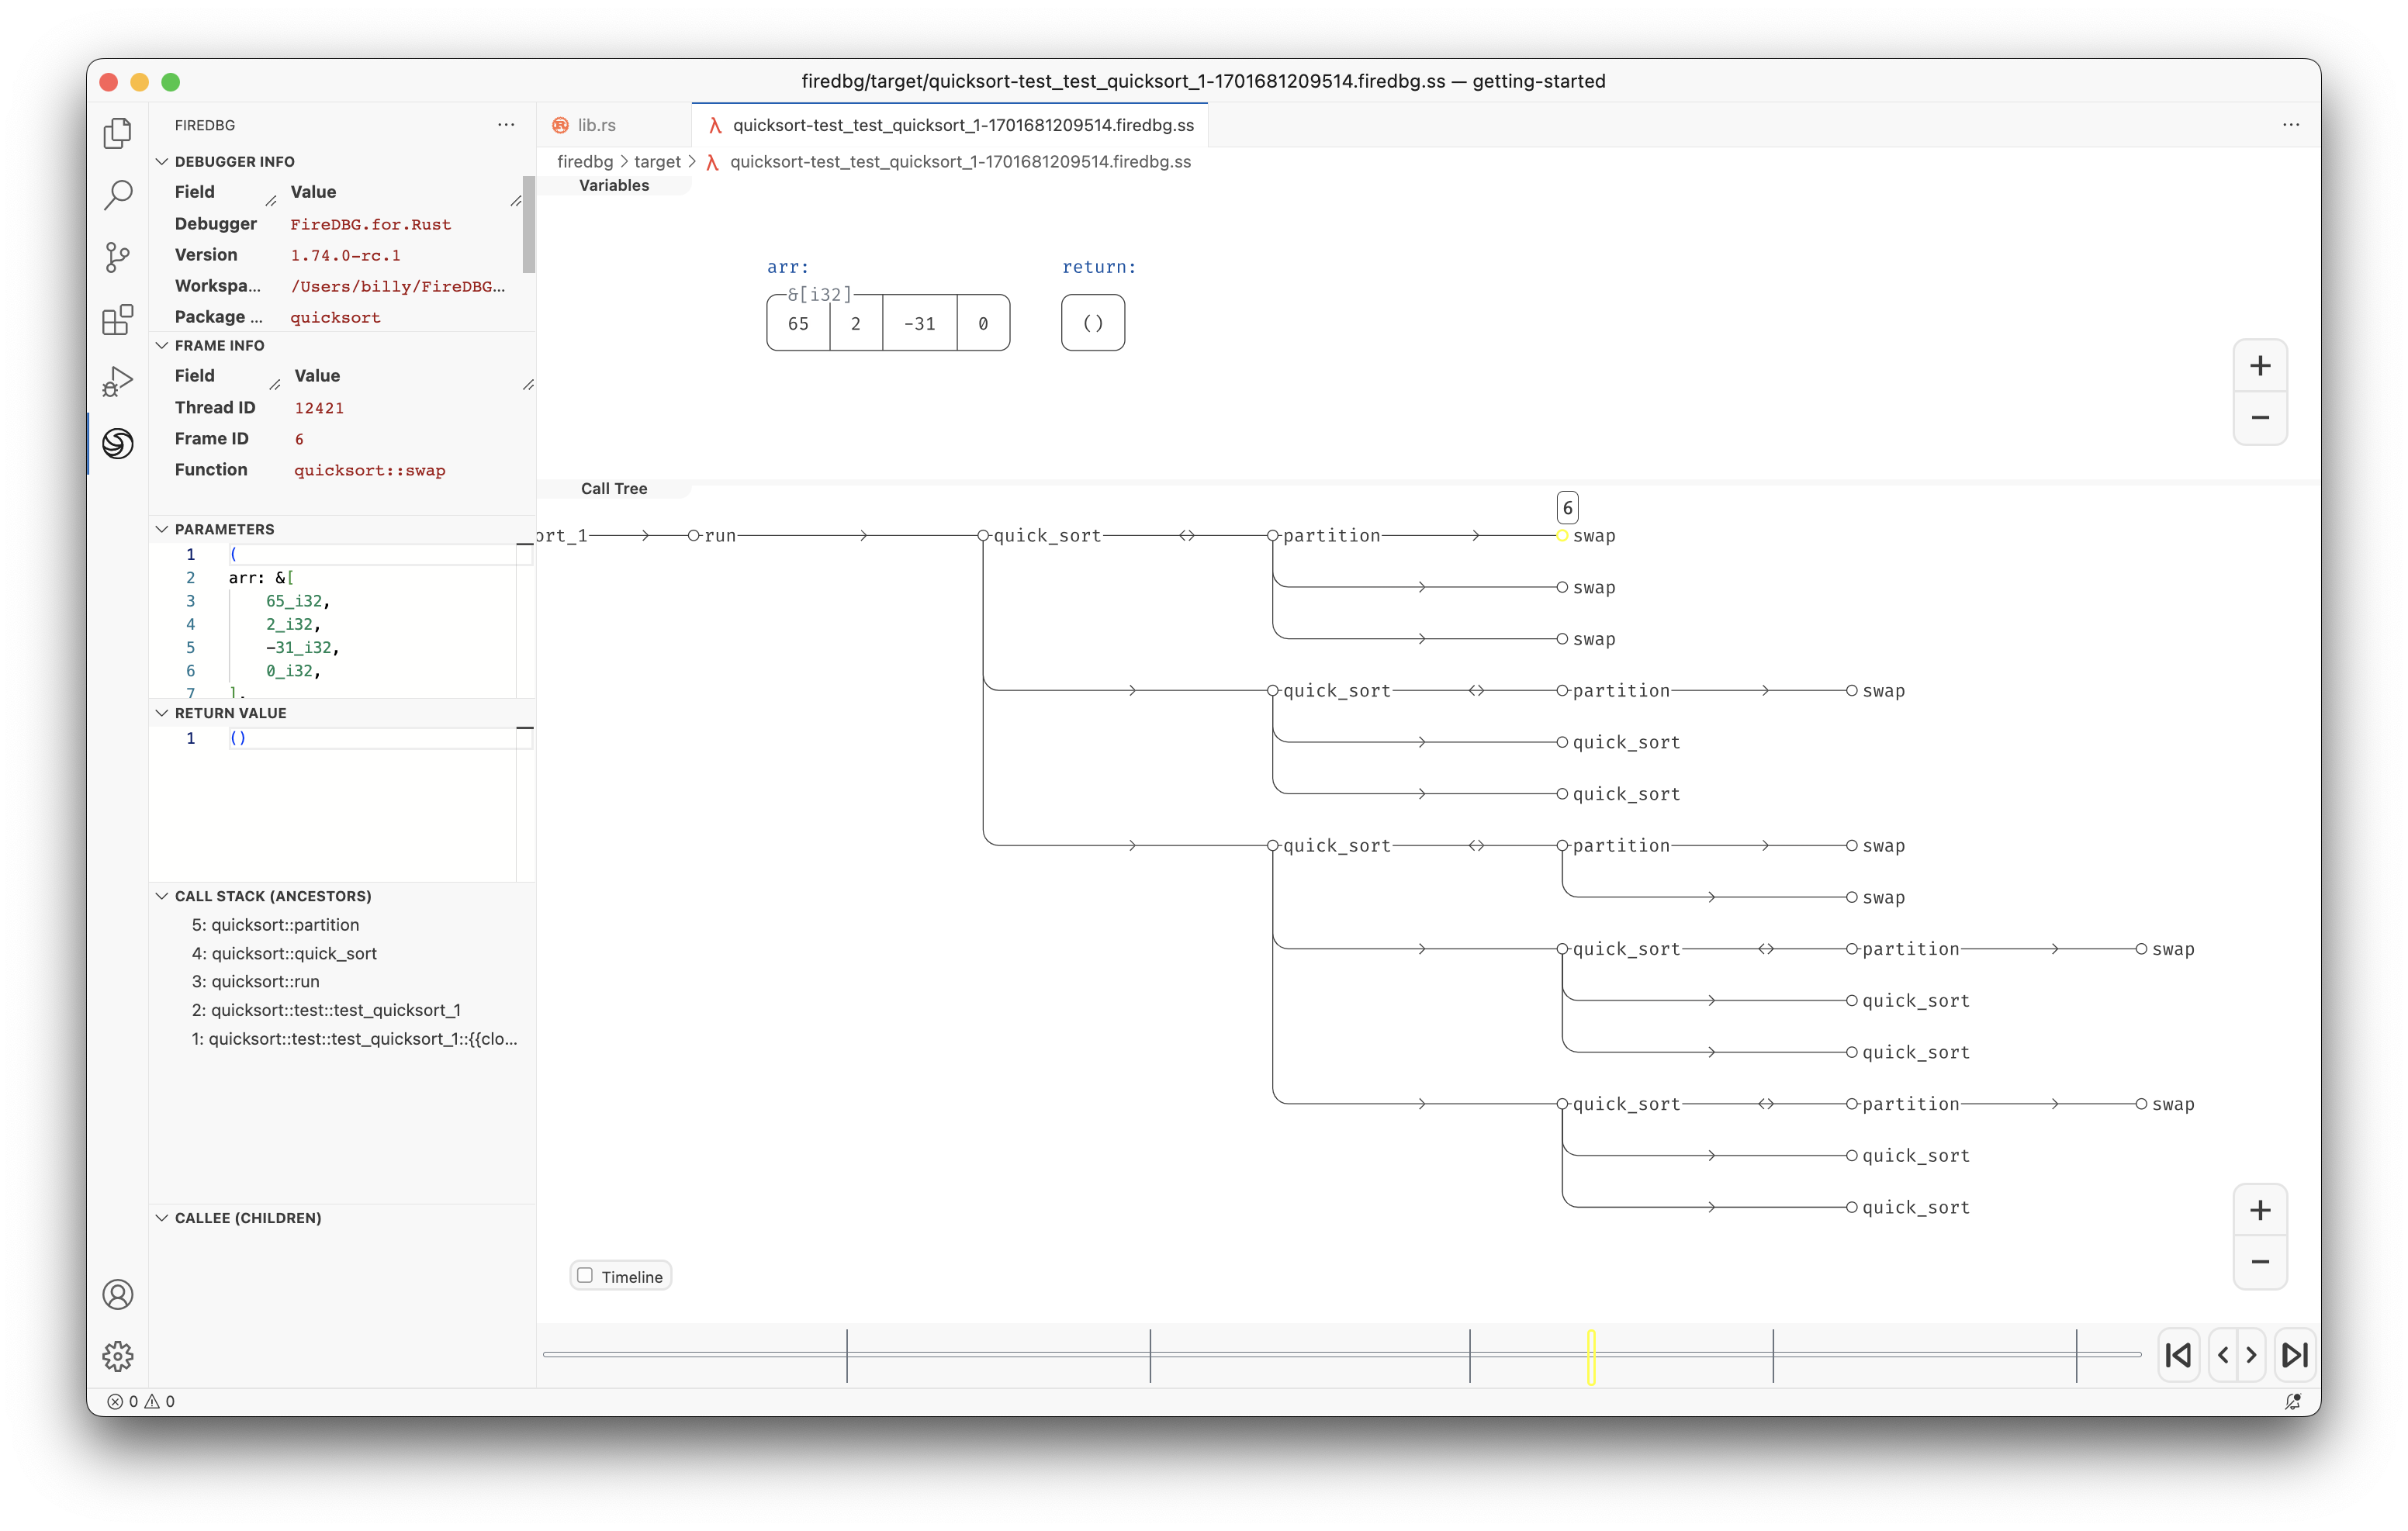
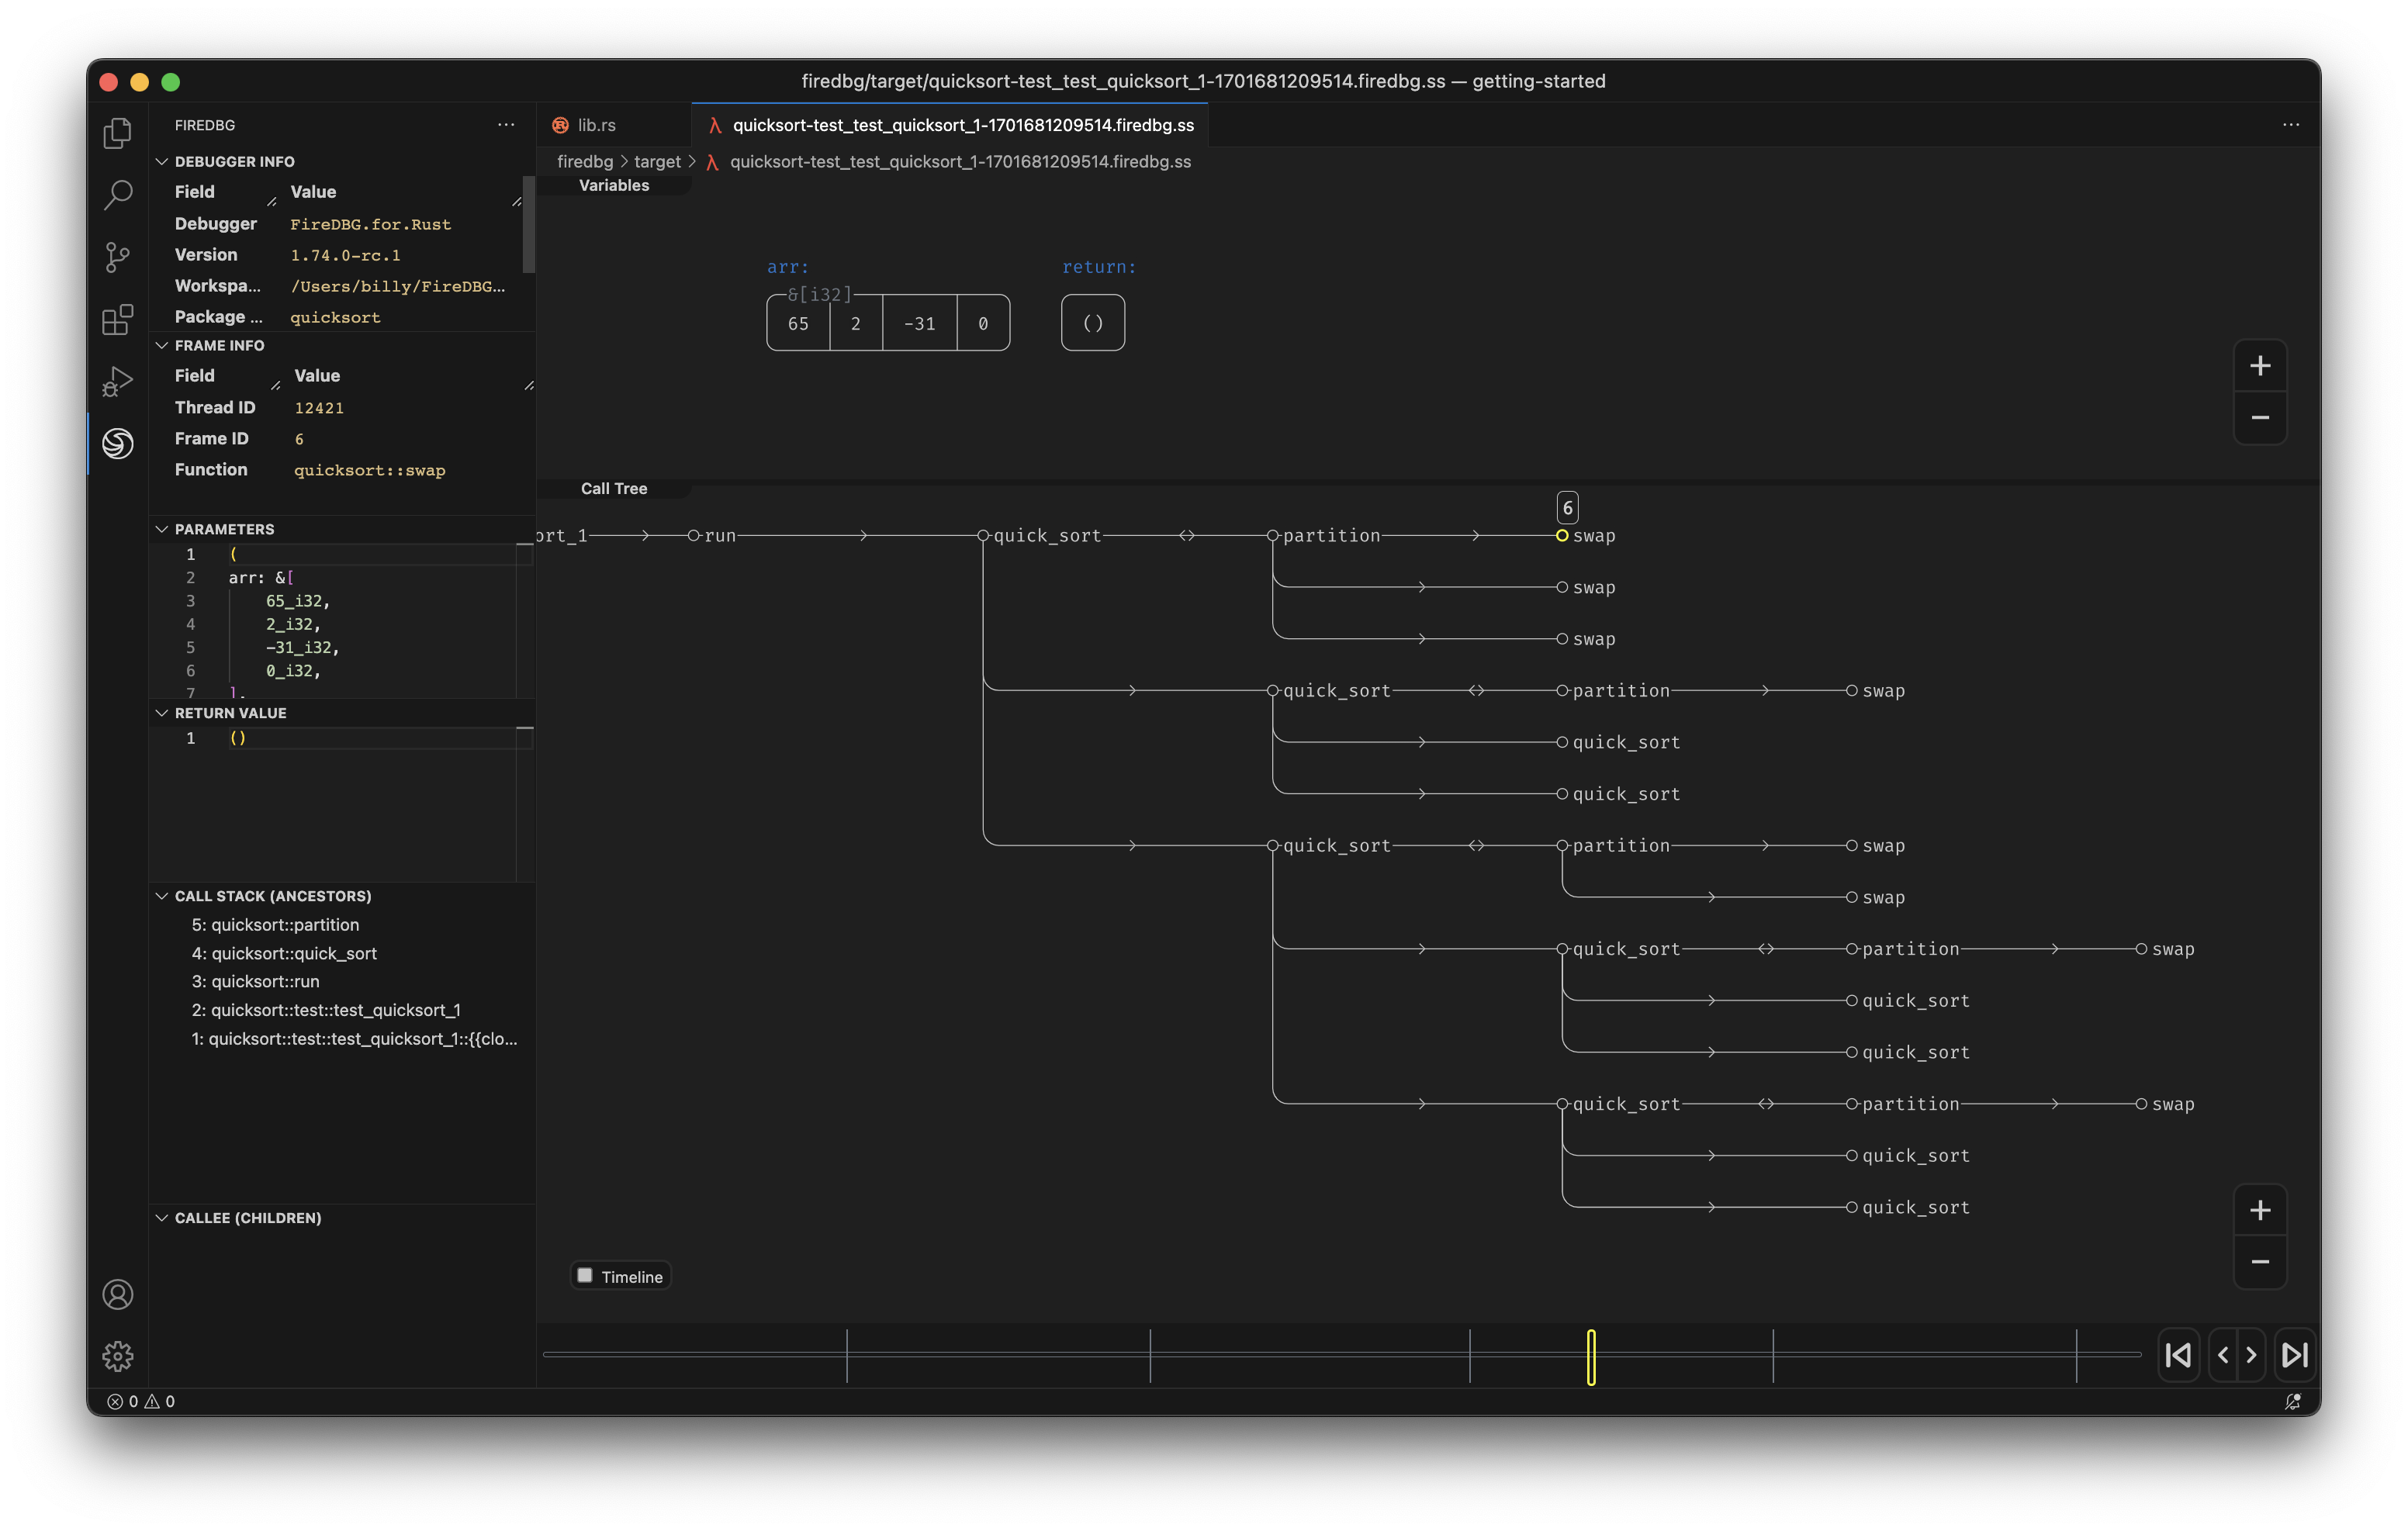
We found that it's quite hard to inspect what elements are swapped in each partition.
To help debugging, we can add a swap function and rewrite the original code:
fn partition<T: PartialOrd>(arr: &mut [T], low: isize, high: isize) -> isize {
    let pivot = high as usize;
    let mut store_index = low - 1;
    let mut last_index = high;

    loop {
        store_index += 1;
        while arr[store_index as usize] < arr[pivot] {
            store_index += 1;
        }
        last_index -= 1;
        while last_index >= 0 && arr[last_index as usize] > arr[pivot] {
            last_index -= 1;
        }
        if store_index >= last_index {
            break;
        } else {
-           arr.swap(store_index as usize, last_index as usize);
+           swap(&mut arr[store_index as usize..=last_index as usize]);
        }
    }
-   arr.swap(store_index as usize, pivot as usize);
+   swap(&mut arr[store_index as usize..=pivot as usize]);
    store_index
}

+ fn swap<T: PartialOrd>(arr: &mut [T]) {
+     arr.swap(0, arr.len() - 1);
+ }
Tip: you can add
#[cfg_attr(not(debug_assertions), inline)]to theswapfunction to inline it in release build, so that it will not incur any overhead.
Now, we can clearly see what was swapped and how many times swap was called. Upon a closer inspection we will see a pattern, i.e. the first element is always untouched in all partition operations. That's the bug 🐛!
fire::dbg! Trace Macro
Let's try to debug the same program with a different approach. An non-invasive approach, this time we only trace the swap without modifying the program structure.
FireDBG provide a fire::dbg! macro similar to std::dbg! to capture the variable of interest.
We can trace the swap actions with the help of fire::dbg!. The main advantage compared to std::dbg!, is that the trace data is associated with the stack frame of the calling function.
Undo the previous change and go back to the original implementation.
[dependencies]
+ firedbg-lib = "0.1"
+ use firedbg_lib::fire;

fn partition<T: PartialOrd>(arr: &mut [T], low: isize, high: isize) -> isize {
    let pivot = high as usize;
    let mut store_index = low - 1;
    let mut last_index = high;

    loop {
        store_index += 1;
        while arr[store_index as usize] < arr[pivot] {
            store_index += 1;
        }
        last_index -= 1;
        while last_index >= 0 && arr[last_index as usize] > arr[pivot] {
            last_index -= 1;
        }
        if store_index >= last_index {
            break;
        } else {
+           fire::dbg!("swap", &arr[store_index as usize..=last_index as usize]);
            arr.swap(store_index as usize, last_index as usize);
        }
    }
+   fire::dbg!("swap", &arr[store_index as usize..=pivot as usize]);
    arr.swap(store_index as usize, pivot as usize);
    store_index
}
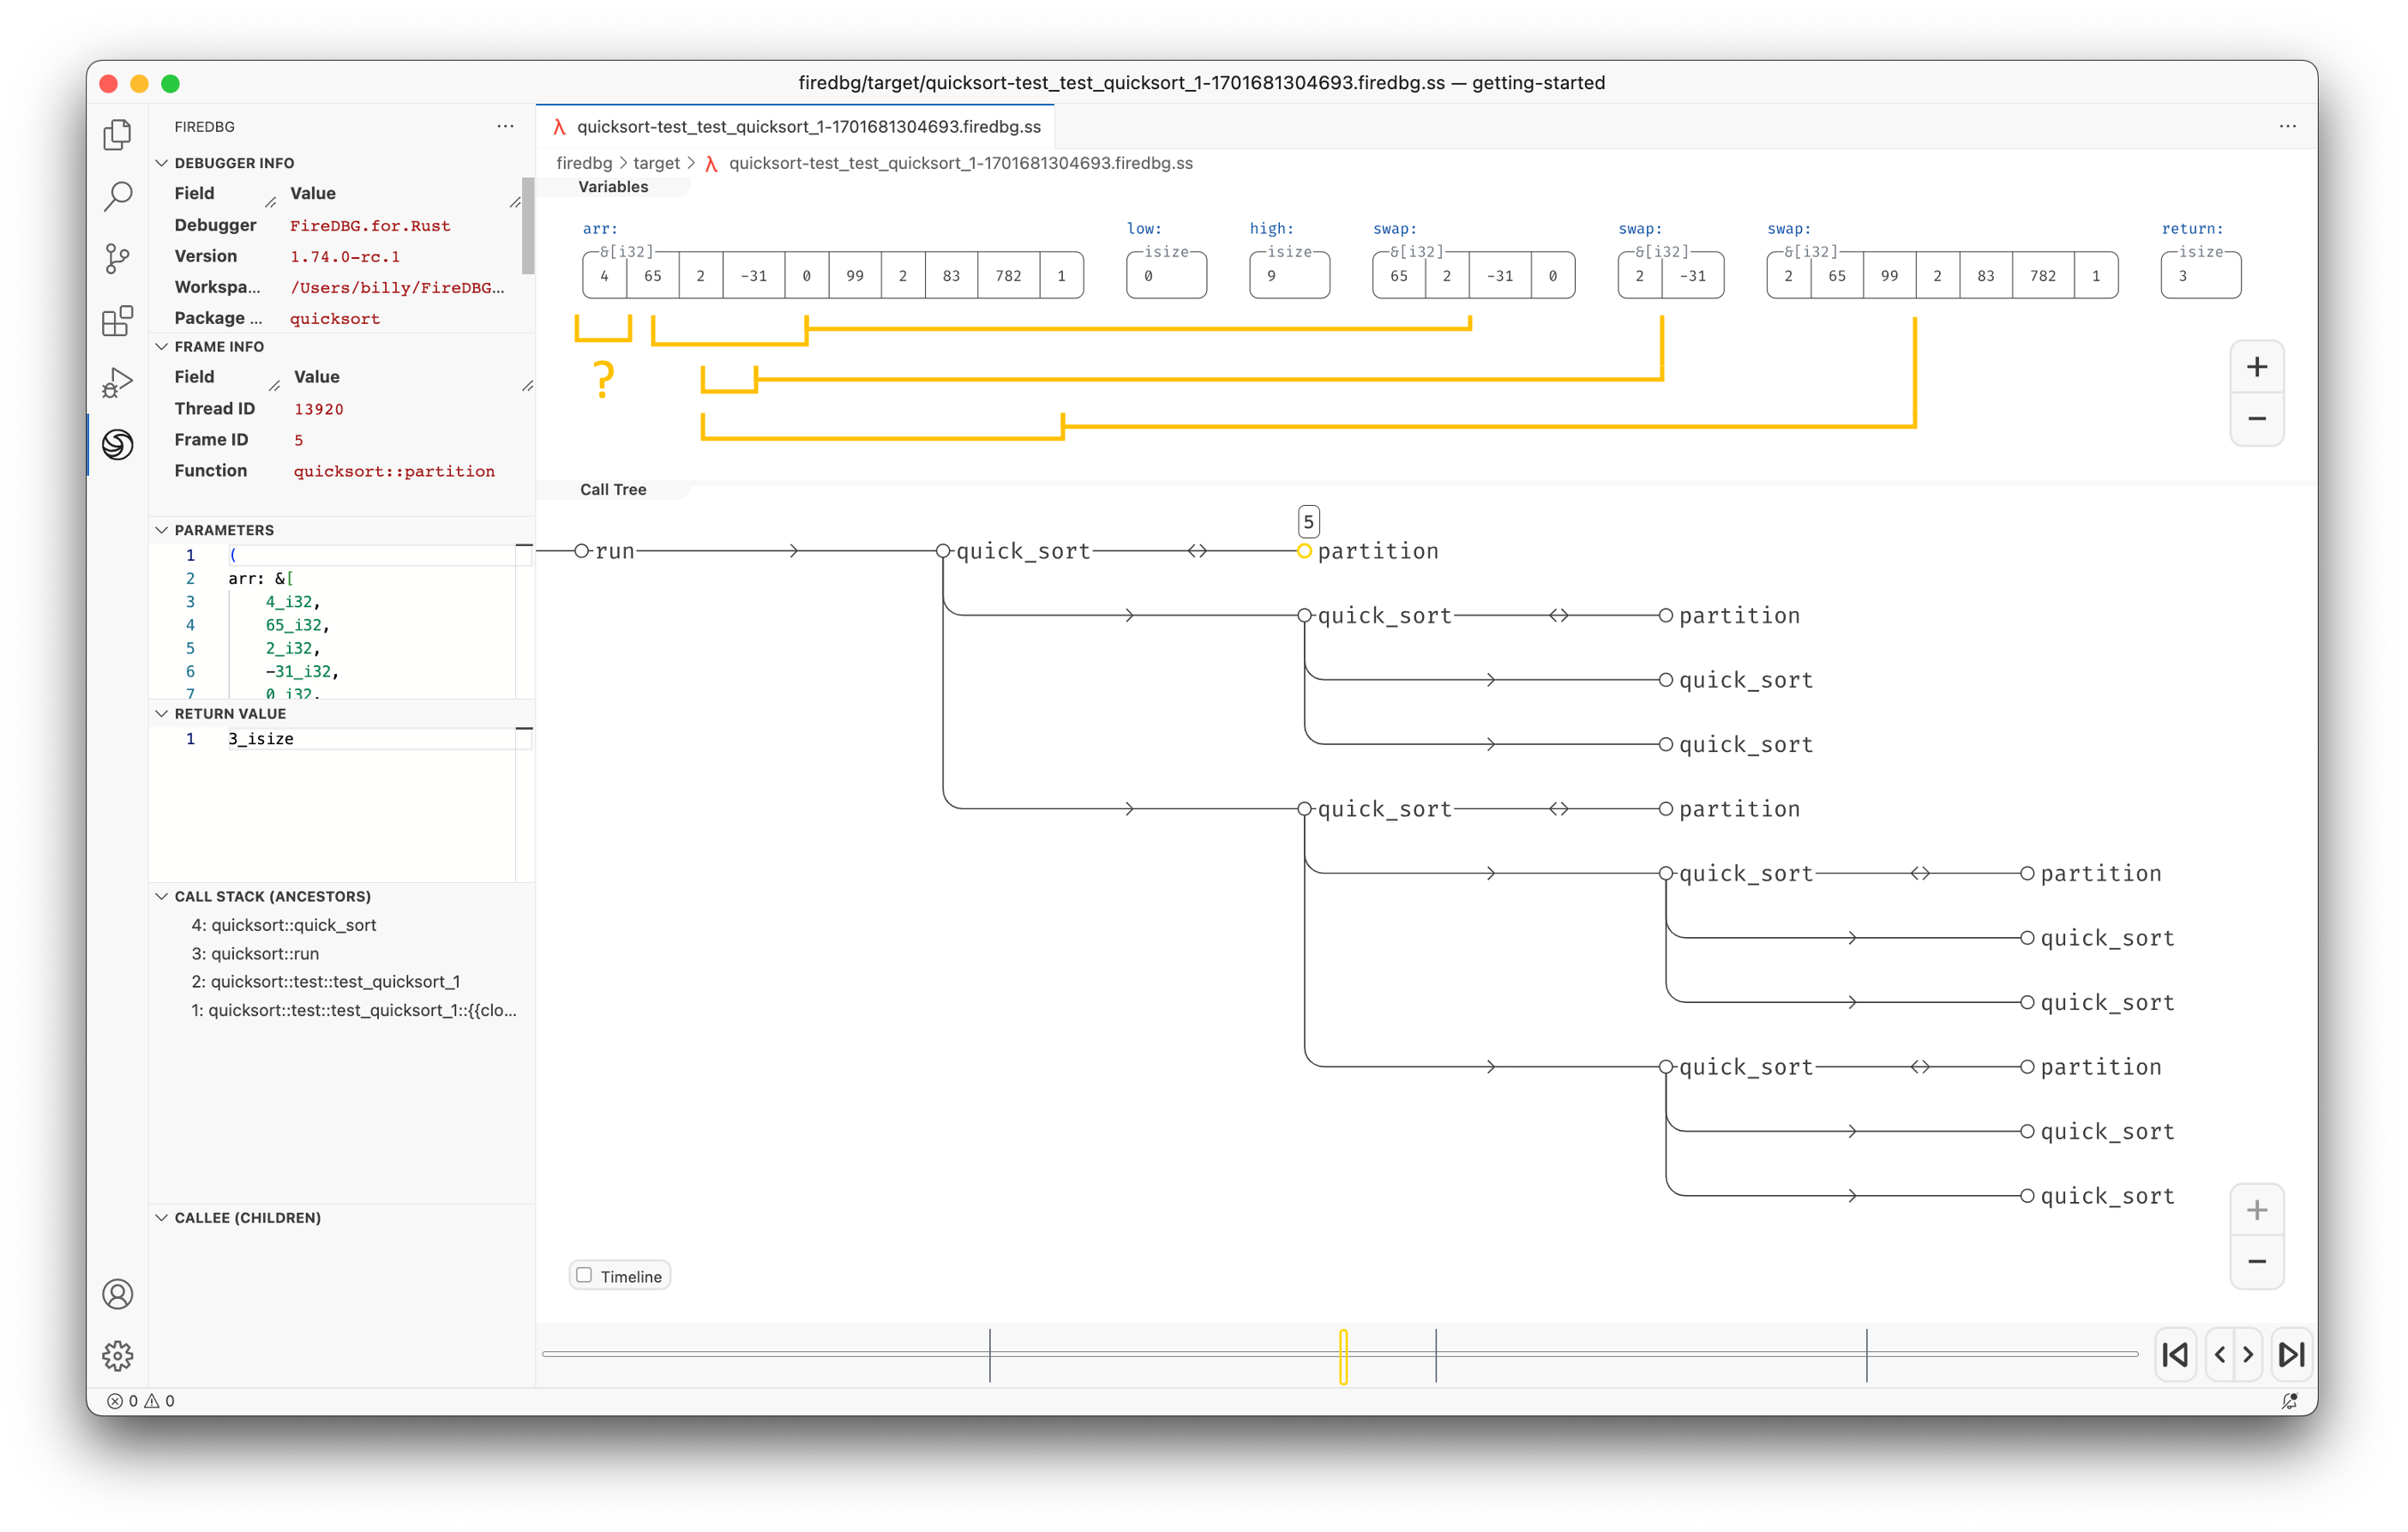
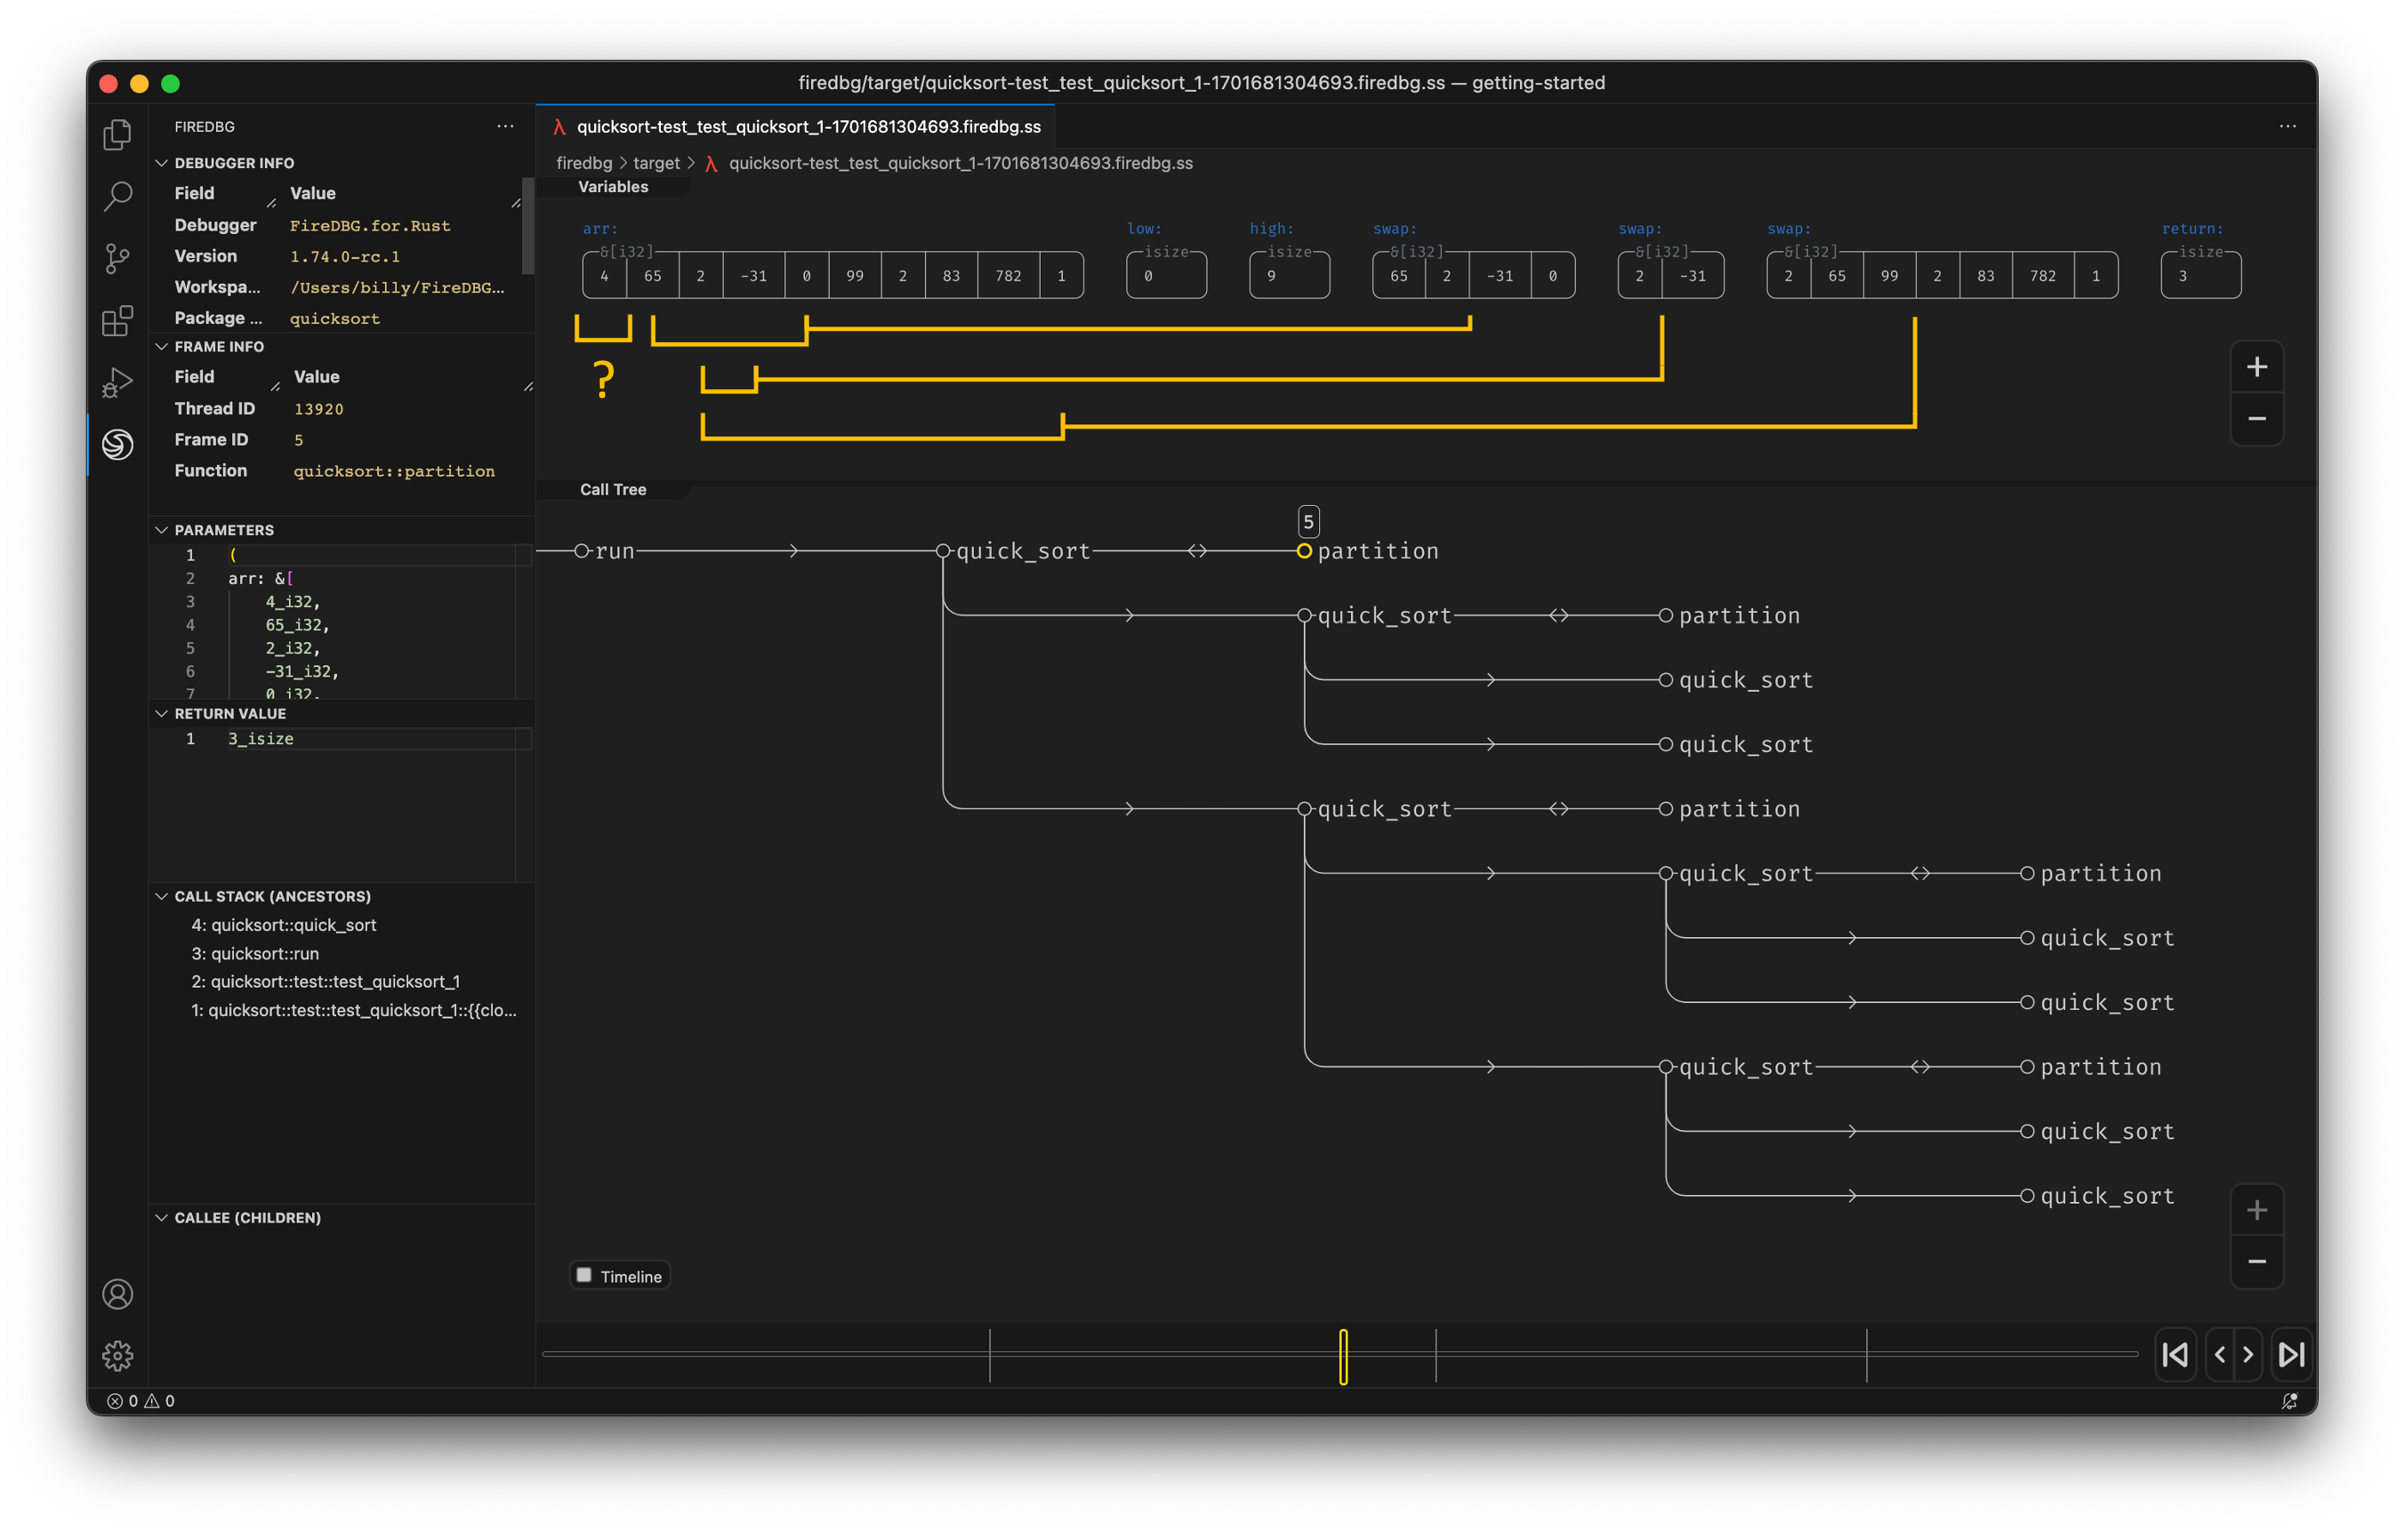
This time the swap is shown in the variables of the partition function. As expected, we see 3 swaps. This should help us to observe the pattern, locate and fix the bug 🔎!
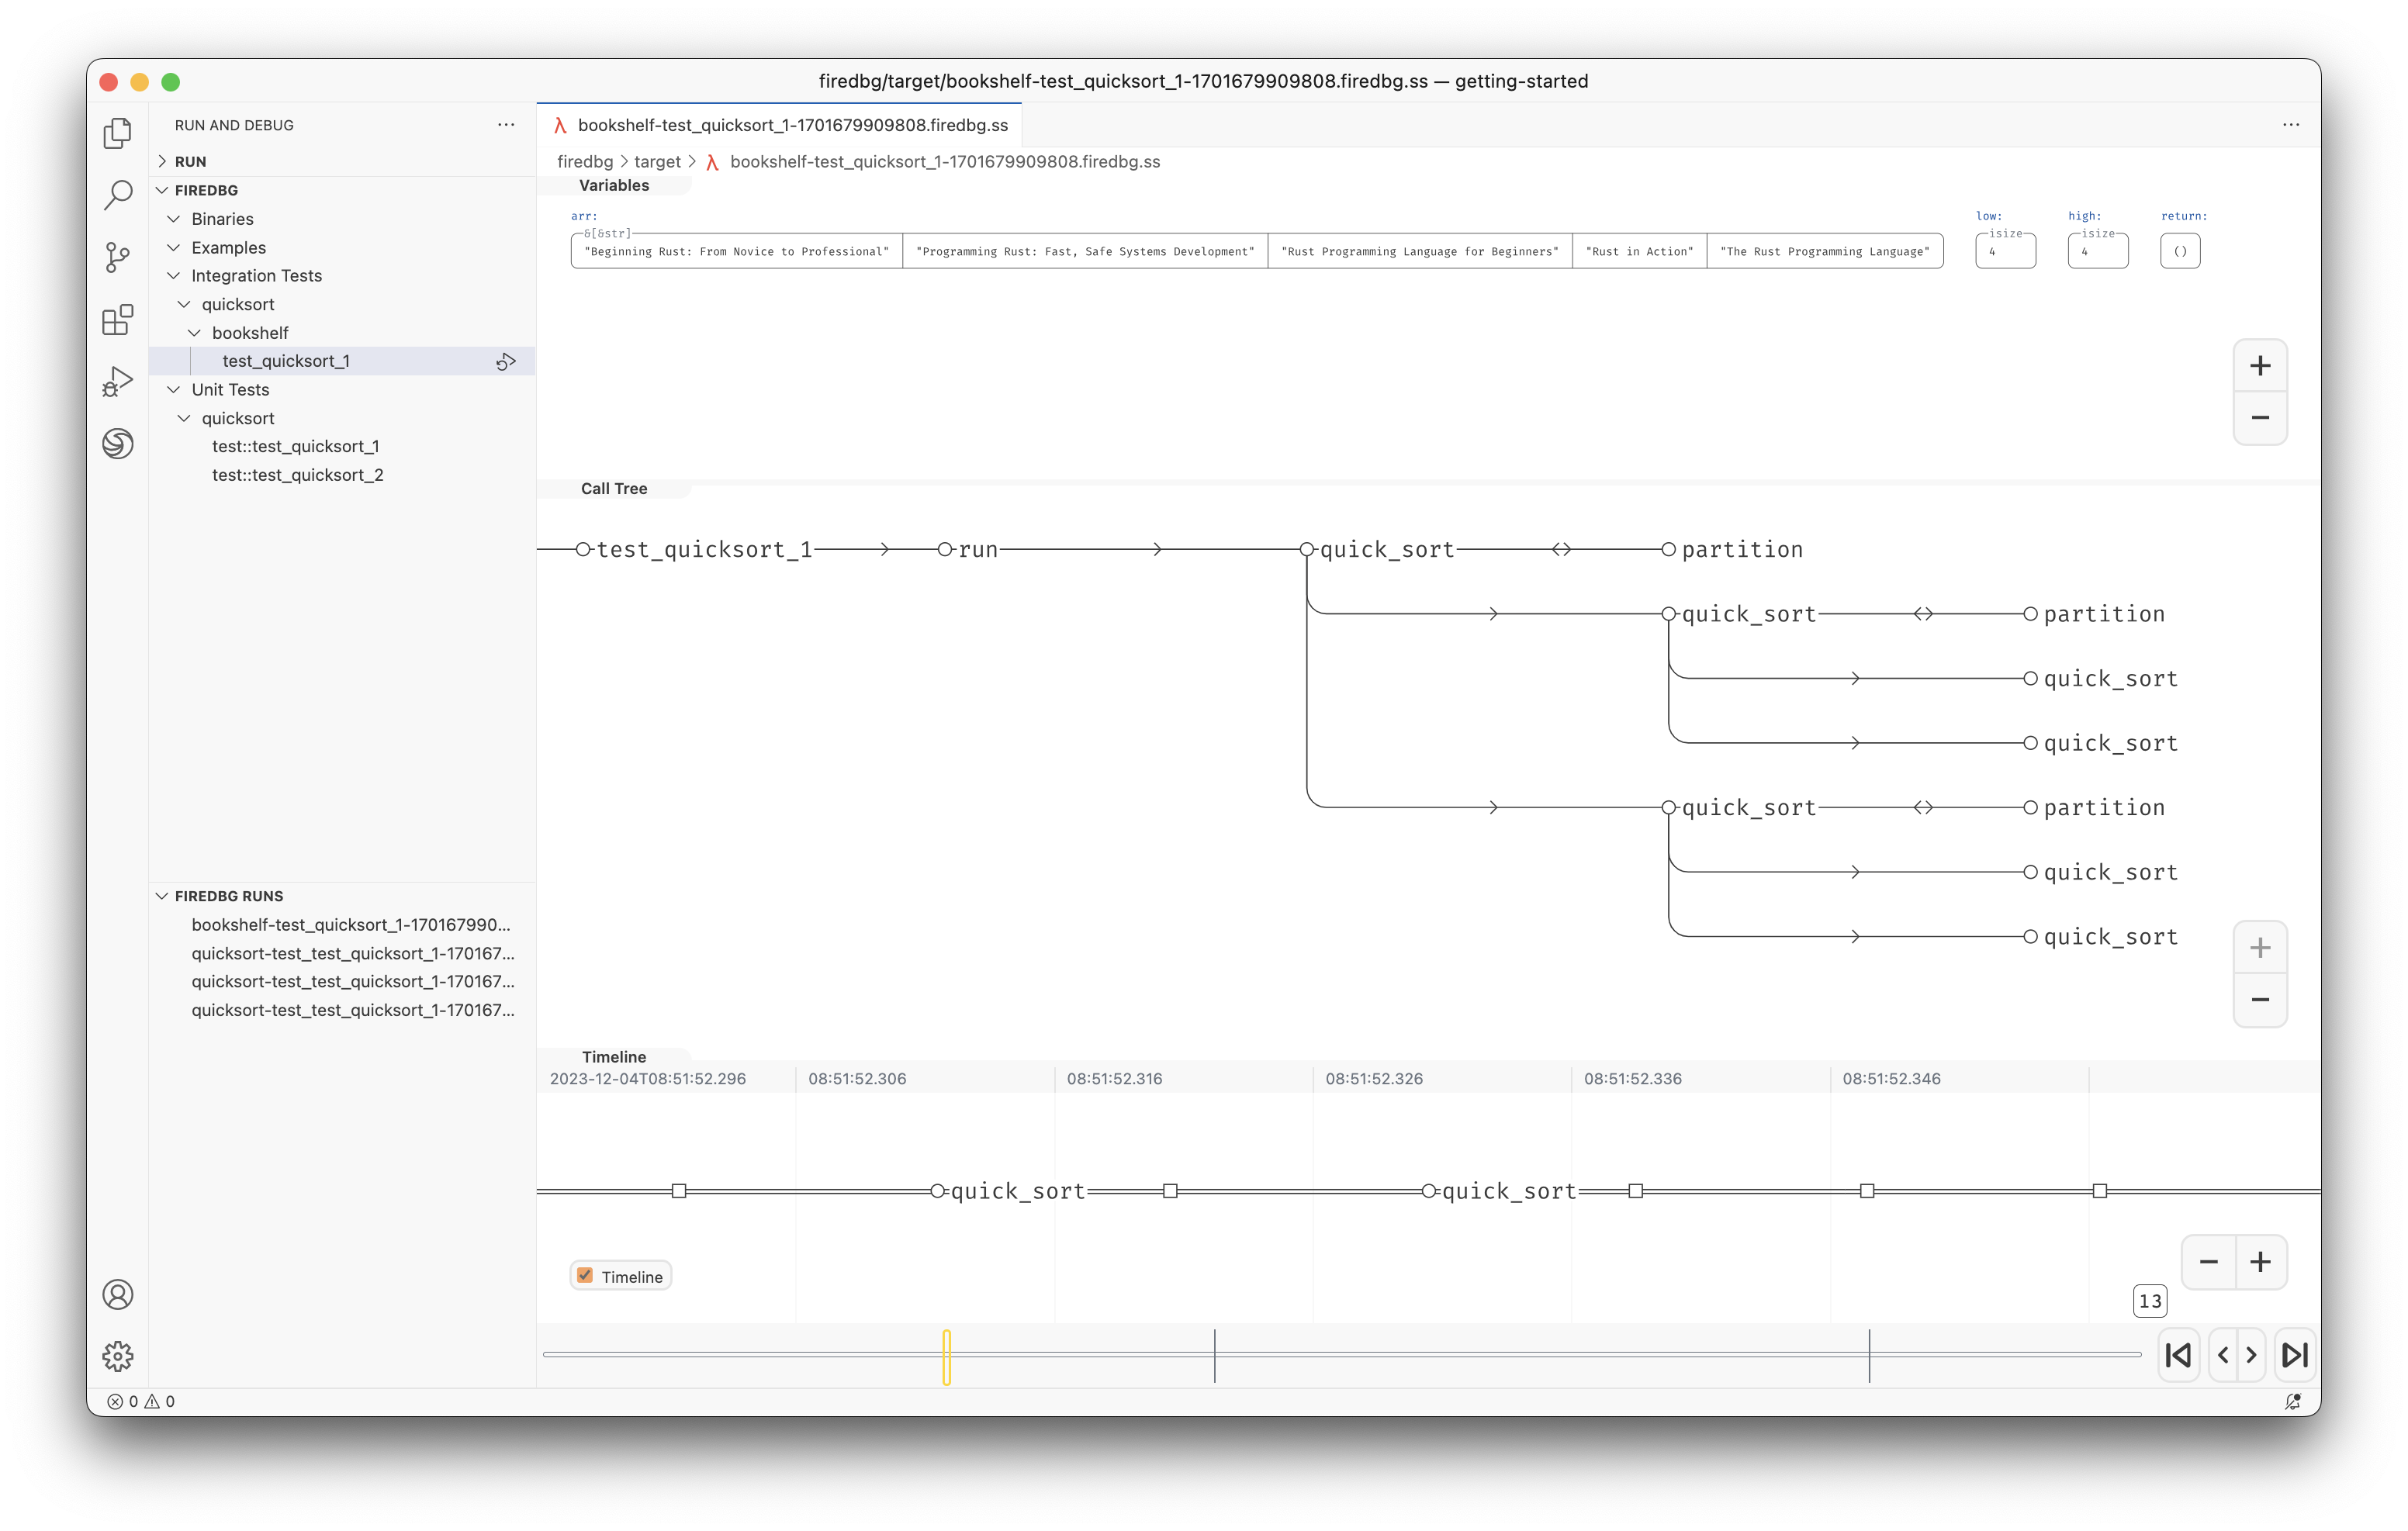
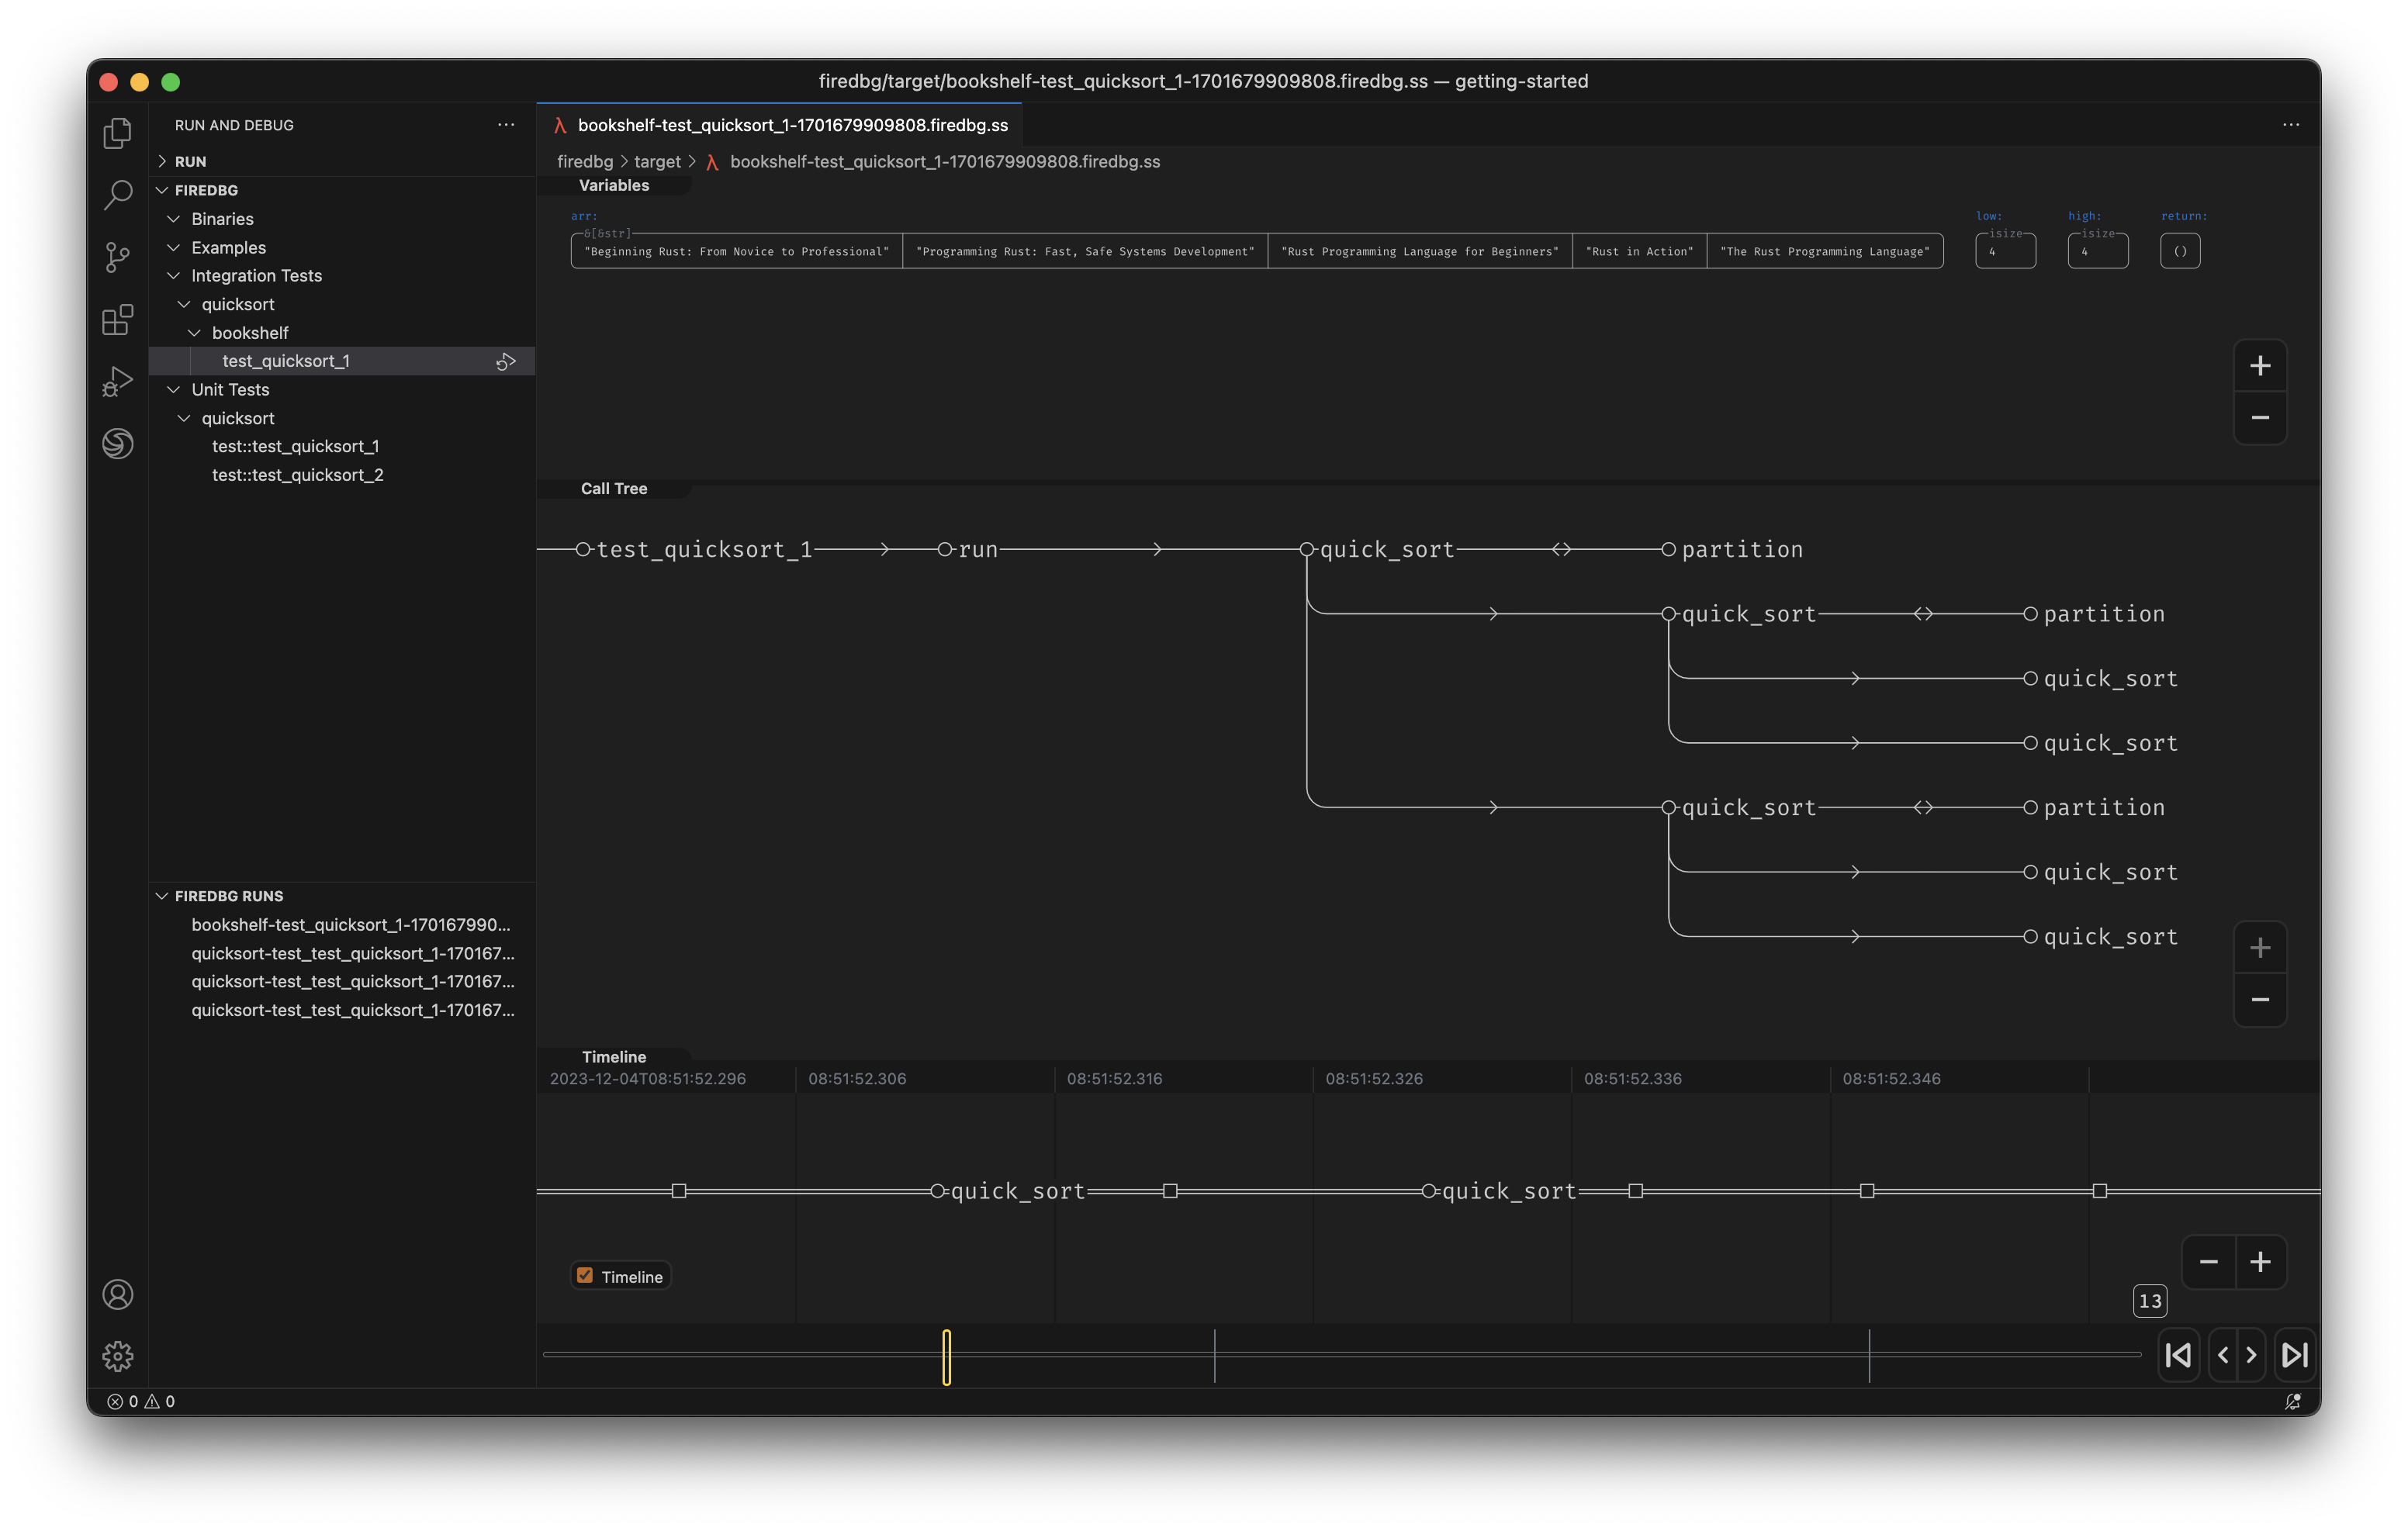
Debugging Integration Tests
Similar to unit test, we can debug integration test with FireDBG. Let's add an integration test file:
#[test]
fn test_quicksort_1() {
    let mut books = [
        "The Rust Programming Language",
        "Beginning Rust: From Novice to Professional",
        "Rust in Action",
        "Programming Rust: Fast, Safe Systems Development",
        "Rust Programming Language for Beginners",
    ];
    quicksort::run(&mut books);
    assert_eq!(
        books,
        [
            "Beginning Rust: From Novice to Professional",
            "Programming Rust: Fast, Safe Systems Development",
            "Rust Programming Language for Beginners",
            "Rust in Action",
            "The Rust Programming Language",
        ]
    );
}
Alternatively, you can debug integration test with the CLI:
firedbg test bookshelf test_quicksort_1
Debugging Binary Targets
Let's create an executable program. We need to add some dependencies first.
[dependencies]
firedbg-lib = "0.1"
+ fastrand = "2"
+ structopt = "0.3"
use firedbg_lib::fire;
use std::iter::repeat_with;
use structopt::StructOpt;

#[derive(StructOpt, Debug)]
struct Opt {
    /// Random seed
    #[structopt(long, default_value = "2525")]
    seed: u64,
    /// Number of random numbers to be sorted
    #[structopt(default_value = "10")]
    n: usize,
}

fn main() {
    let Opt { seed, n } = Opt::from_args();

    fire::dbg!(&seed);
    fire::dbg!(&n);

    fastrand::seed(seed);

    let max = if n <= 10 { 100 } else { 1000 };

    println!("Sort {n} numbers in ascending order");
    let mut numbers: Vec<_> = repeat_with(|| fastrand::i32(1..max)).take(n).collect();

    println!("Input:  {:?}", numbers);
    quicksort::run(&mut numbers);
    println!("Sorted: {:?}", numbers);

    let mut c = 0;
    for n in numbers {
        assert!(n >= c);
        c = n;
    }
}
We can add a [[targets]] entry in firedbg.toml to create additional profiles:
[[targets]]
name = "quicksort_100"
target.type = "binary"
target.name = "quicksort"
argv = ["100", "--seed", "1212"]
See the full example.
Or use the FireDBG CLI to pass additional parameters to the Rust binary:
firedbg run quicksort -- 100 --seed 1212
Debugging Examples
Examples work the same as binary targets, just that they are located under the examples/ directory.
We can also debug example with the CLI:
firedbg example random100
firedbg/ Output Folder
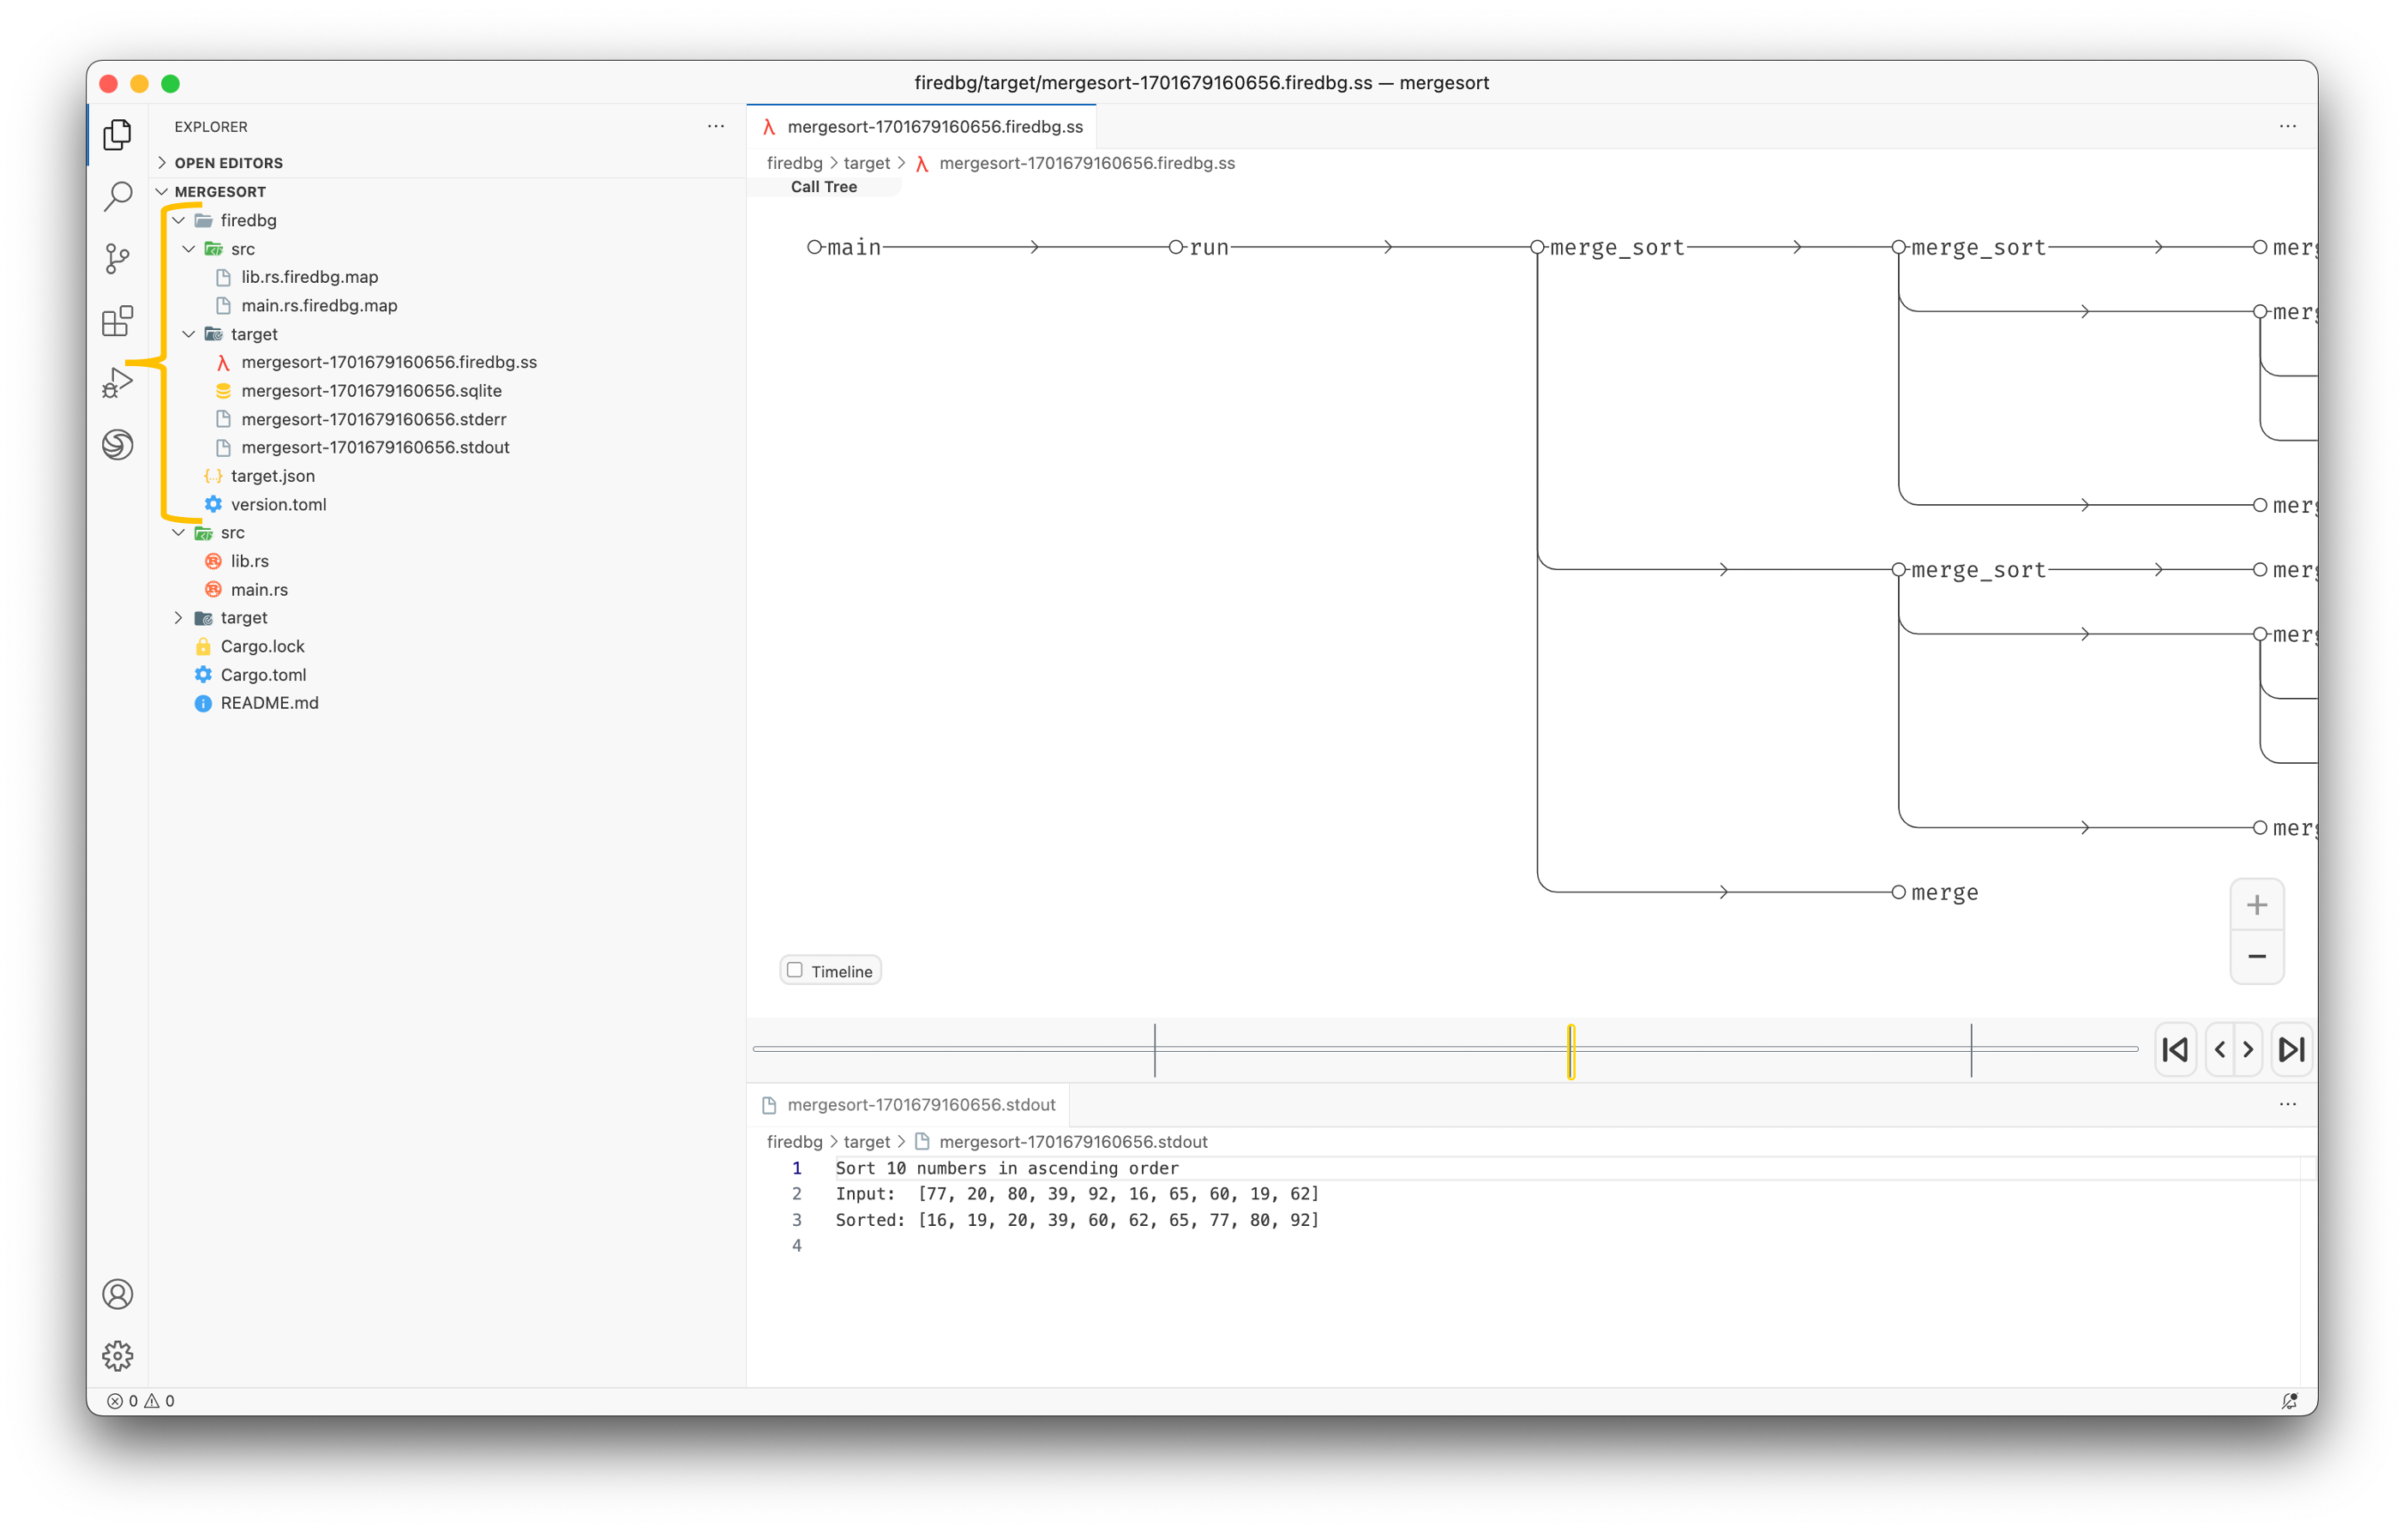
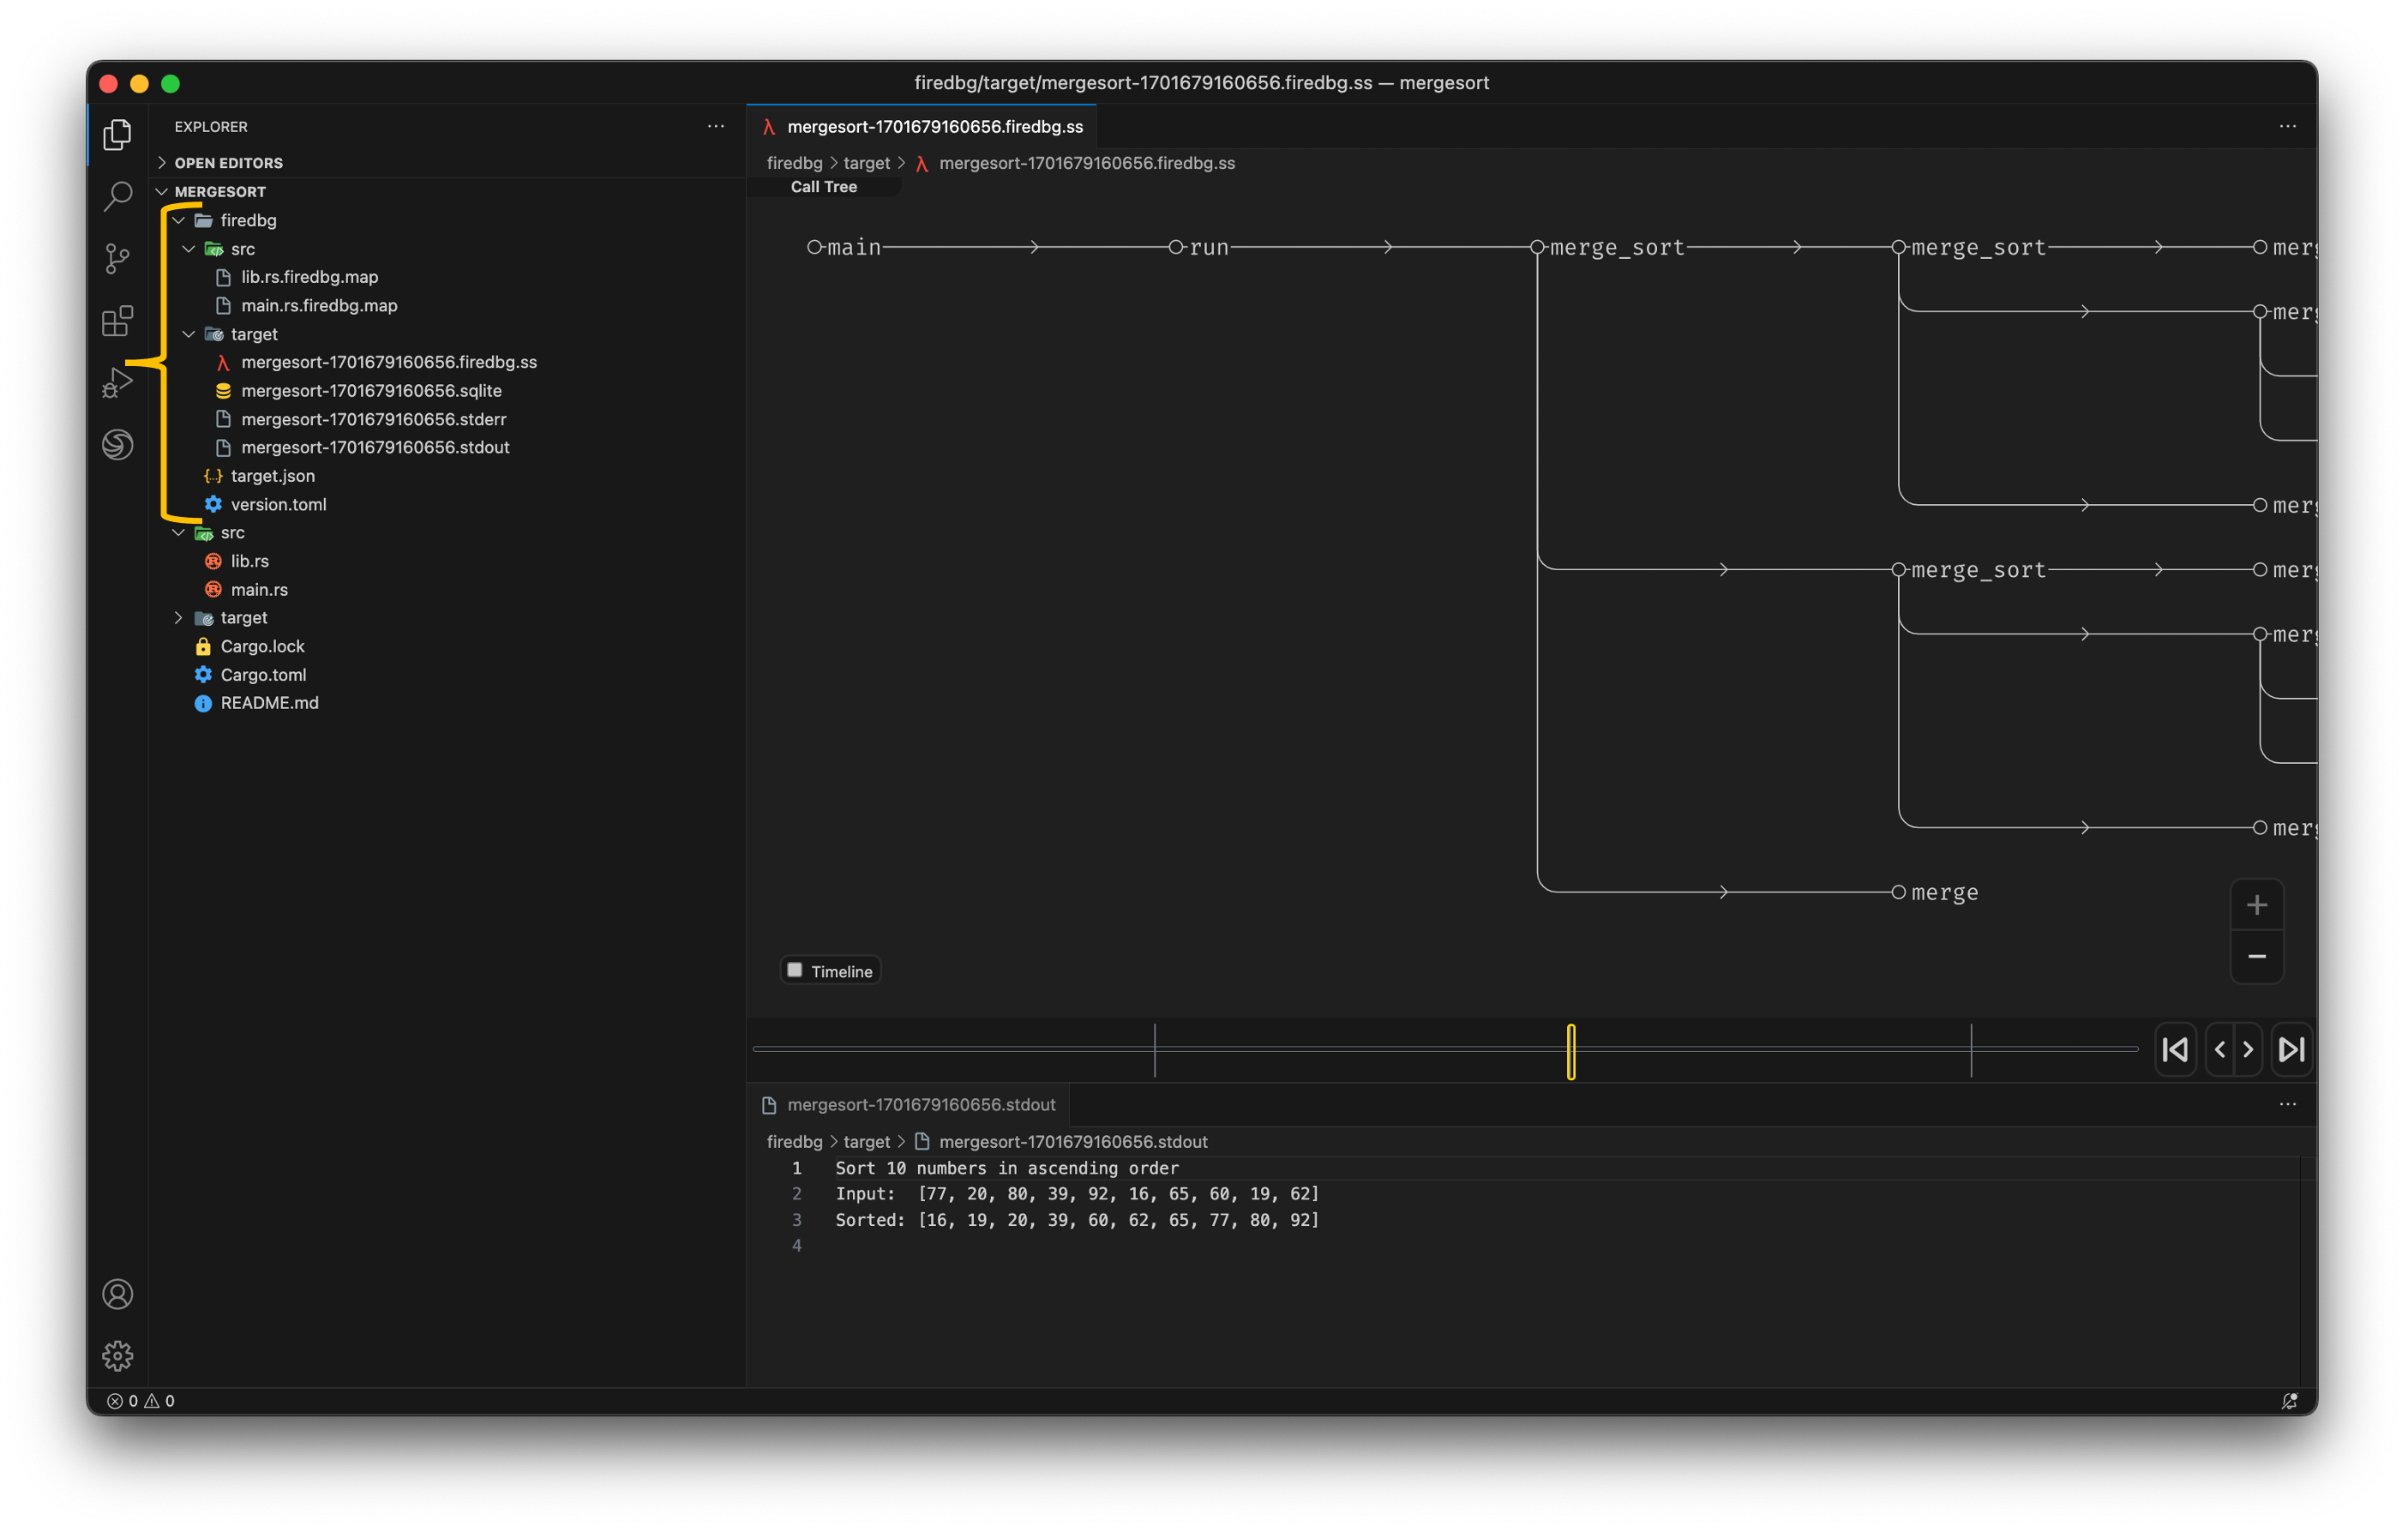
A firedbg folder will be created for storing the symbols, debug runs and other supporting files.
You should ignore this folder from your source control, i.e. add firedbg/ to .gitignore.
firedbg.toml Config
Let's try and add one more crate to the workspace.
$ cargo new --lib book-store
$ cd book-store
Update the Cargo.toml at workspace root, adding our new book-store package.
[workspace]
members = ["quicksort", "book-store"]
Below we have a simple function to list the inventory in alphabetical order.
use anyhow::Result;
use std::fs::File;
use std::io::{BufRead, BufReader};

pub fn inventory(path: &str) -> Result<Vec<String>> {
    let file = File::open(path)?;
    let reader = BufReader::new(file);

    let mut books = Vec::new();
    for line in reader.lines() {
        let book = line?.trim().to_owned();
        books.push(book);
    }
    quicksort::run(&mut books);
    Ok(books)
}
To put it in action we can add a books.txt file to the package root and then write a unit test to invoke the inventory function.
The Rust Programming Language
Rust Programming Language for Beginners
Programming Rust: Fast, Safe Systems Development
Beginning Rust: From Novice to Professional
Rust in Action
#[cfg(test)]
mod test {
    use super::*;
    use anyhow::Result;

    #[test]
    fn test_inventory_1() -> Result<()> {
        let path = concat!(env!("CARGO_MANIFEST_DIR"), "/books.txt");
        let books = inventory(path)?;
        assert_eq!(
            books,
            [
                "Beginning Rust: From Novice to Professional",
                "Programming Rust: Fast, Safe Systems Development",
                "Rust Programming Language for Beginners",
                "Rust in Action",
                "The Rust Programming Language",
            ]
        );
        Ok(())
    }
}
Umm... we see that function calls to the quicksort crate are missing in the call tree.
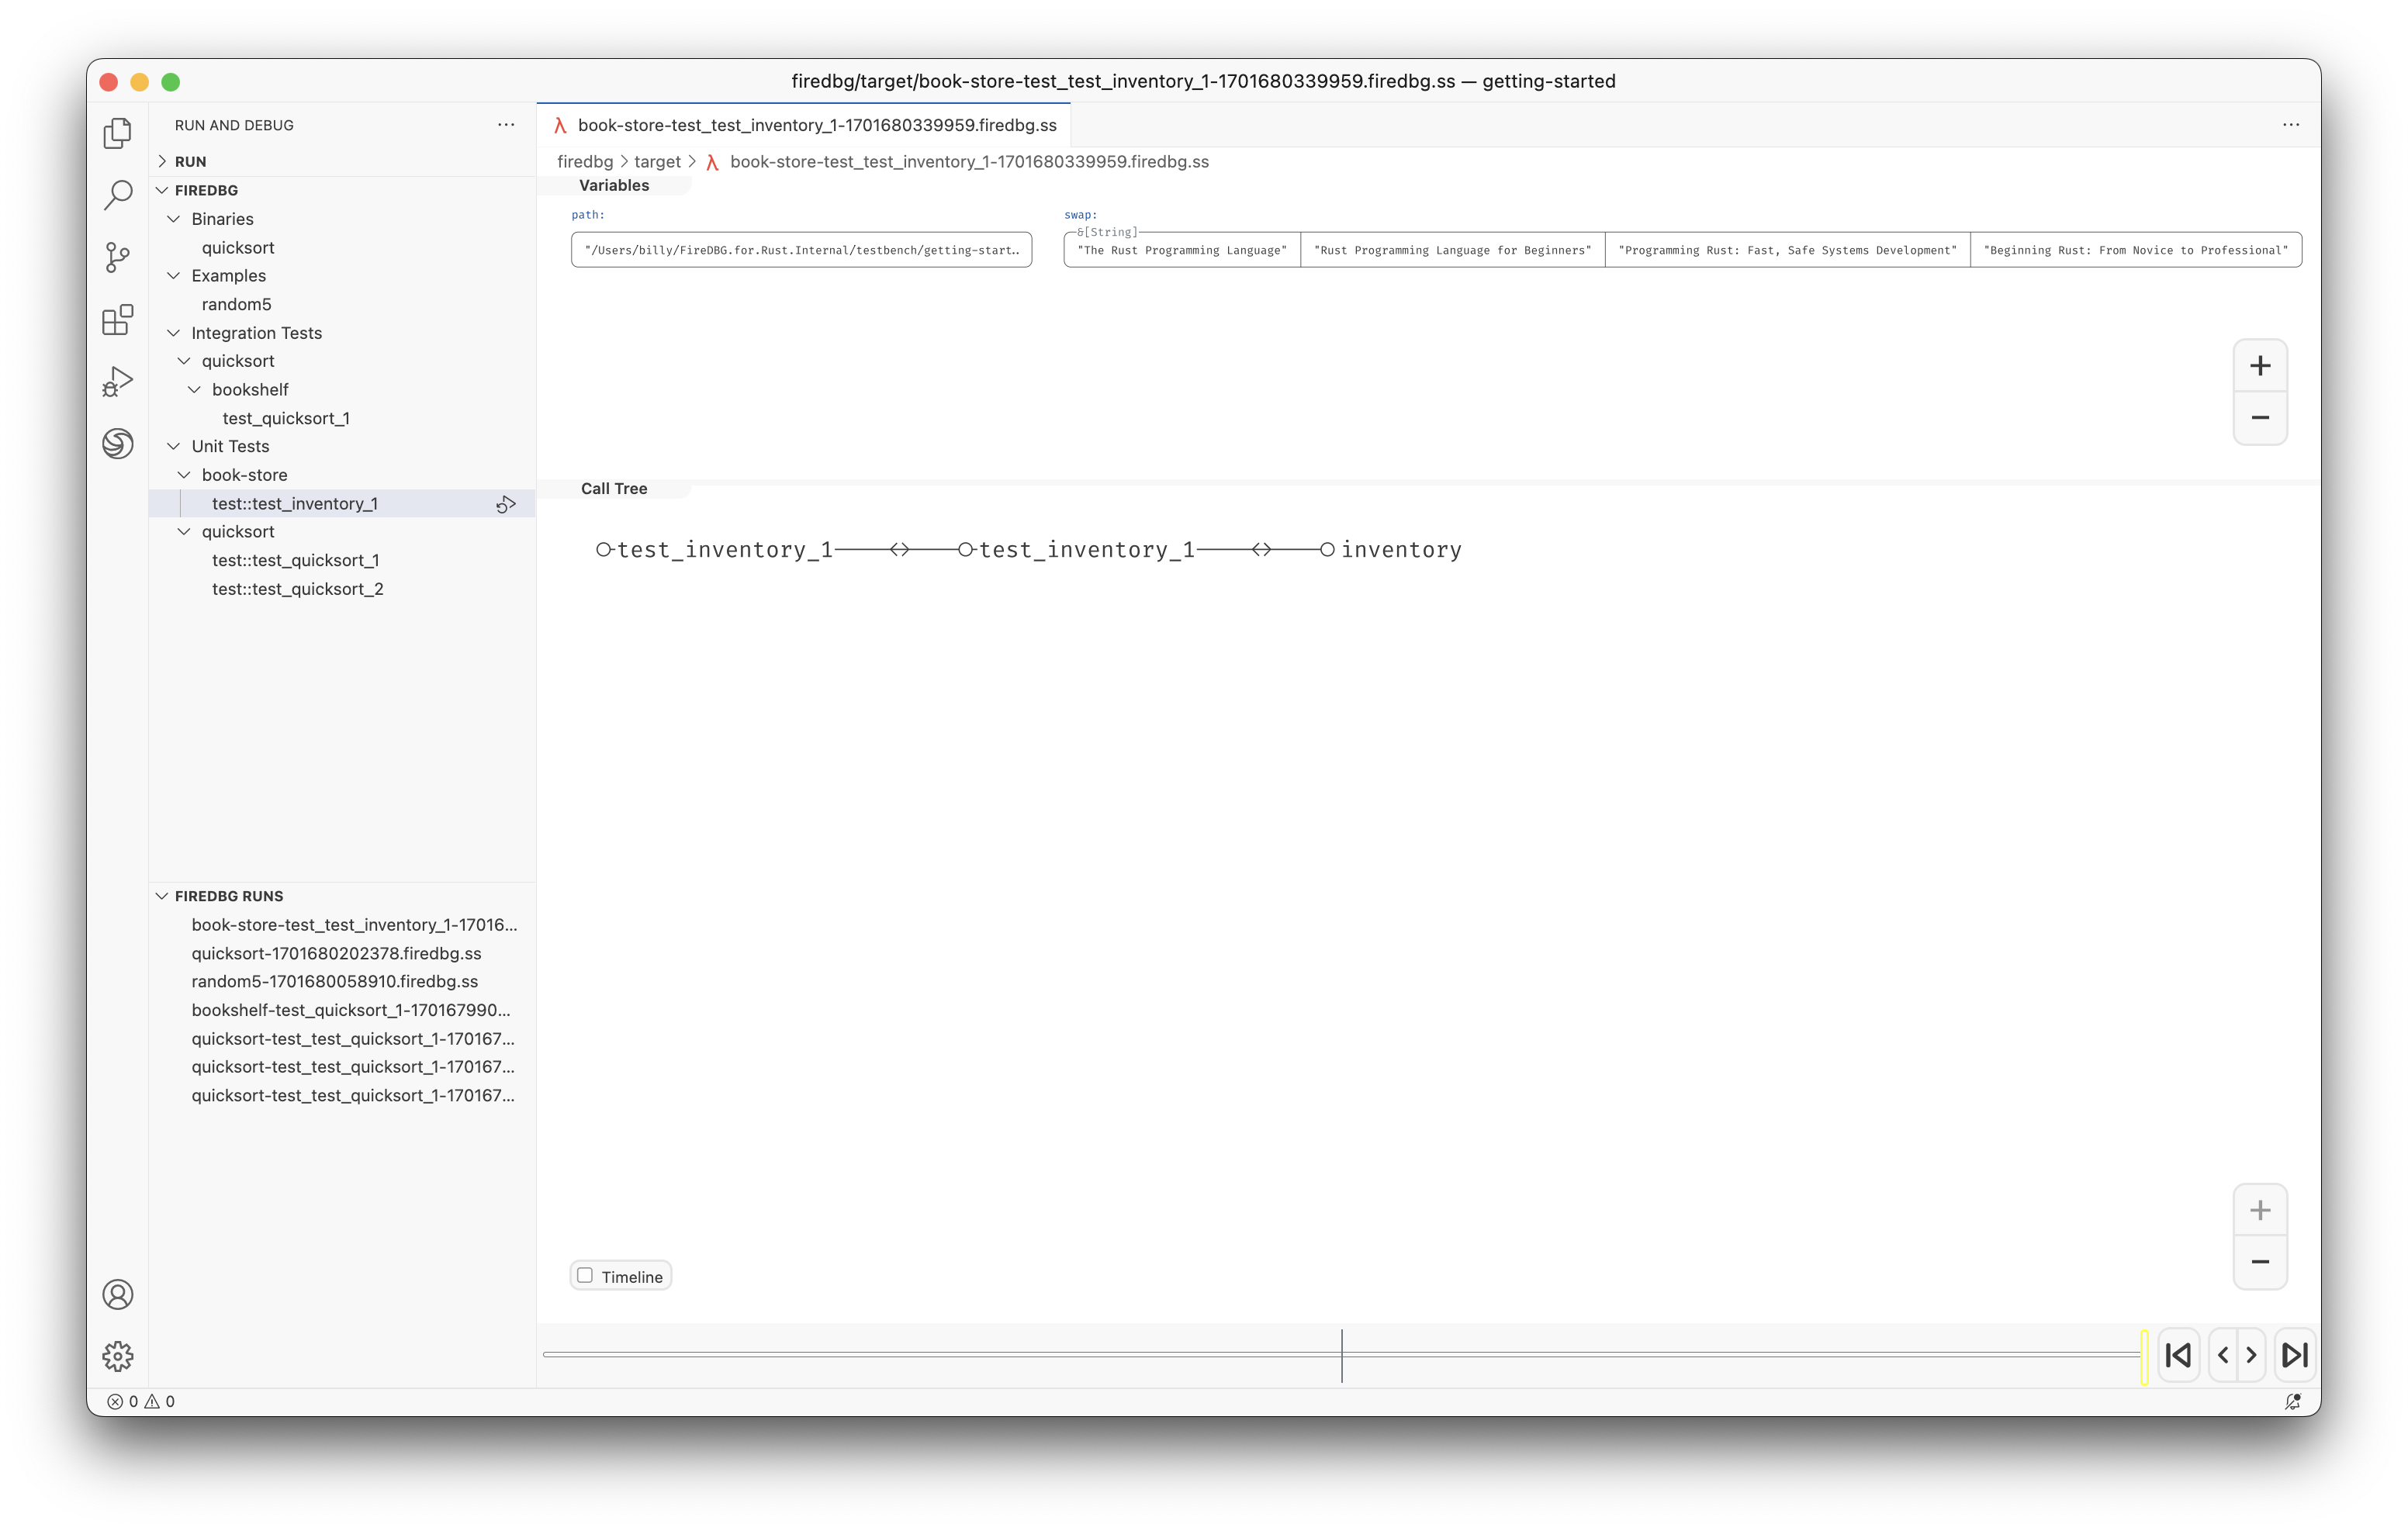
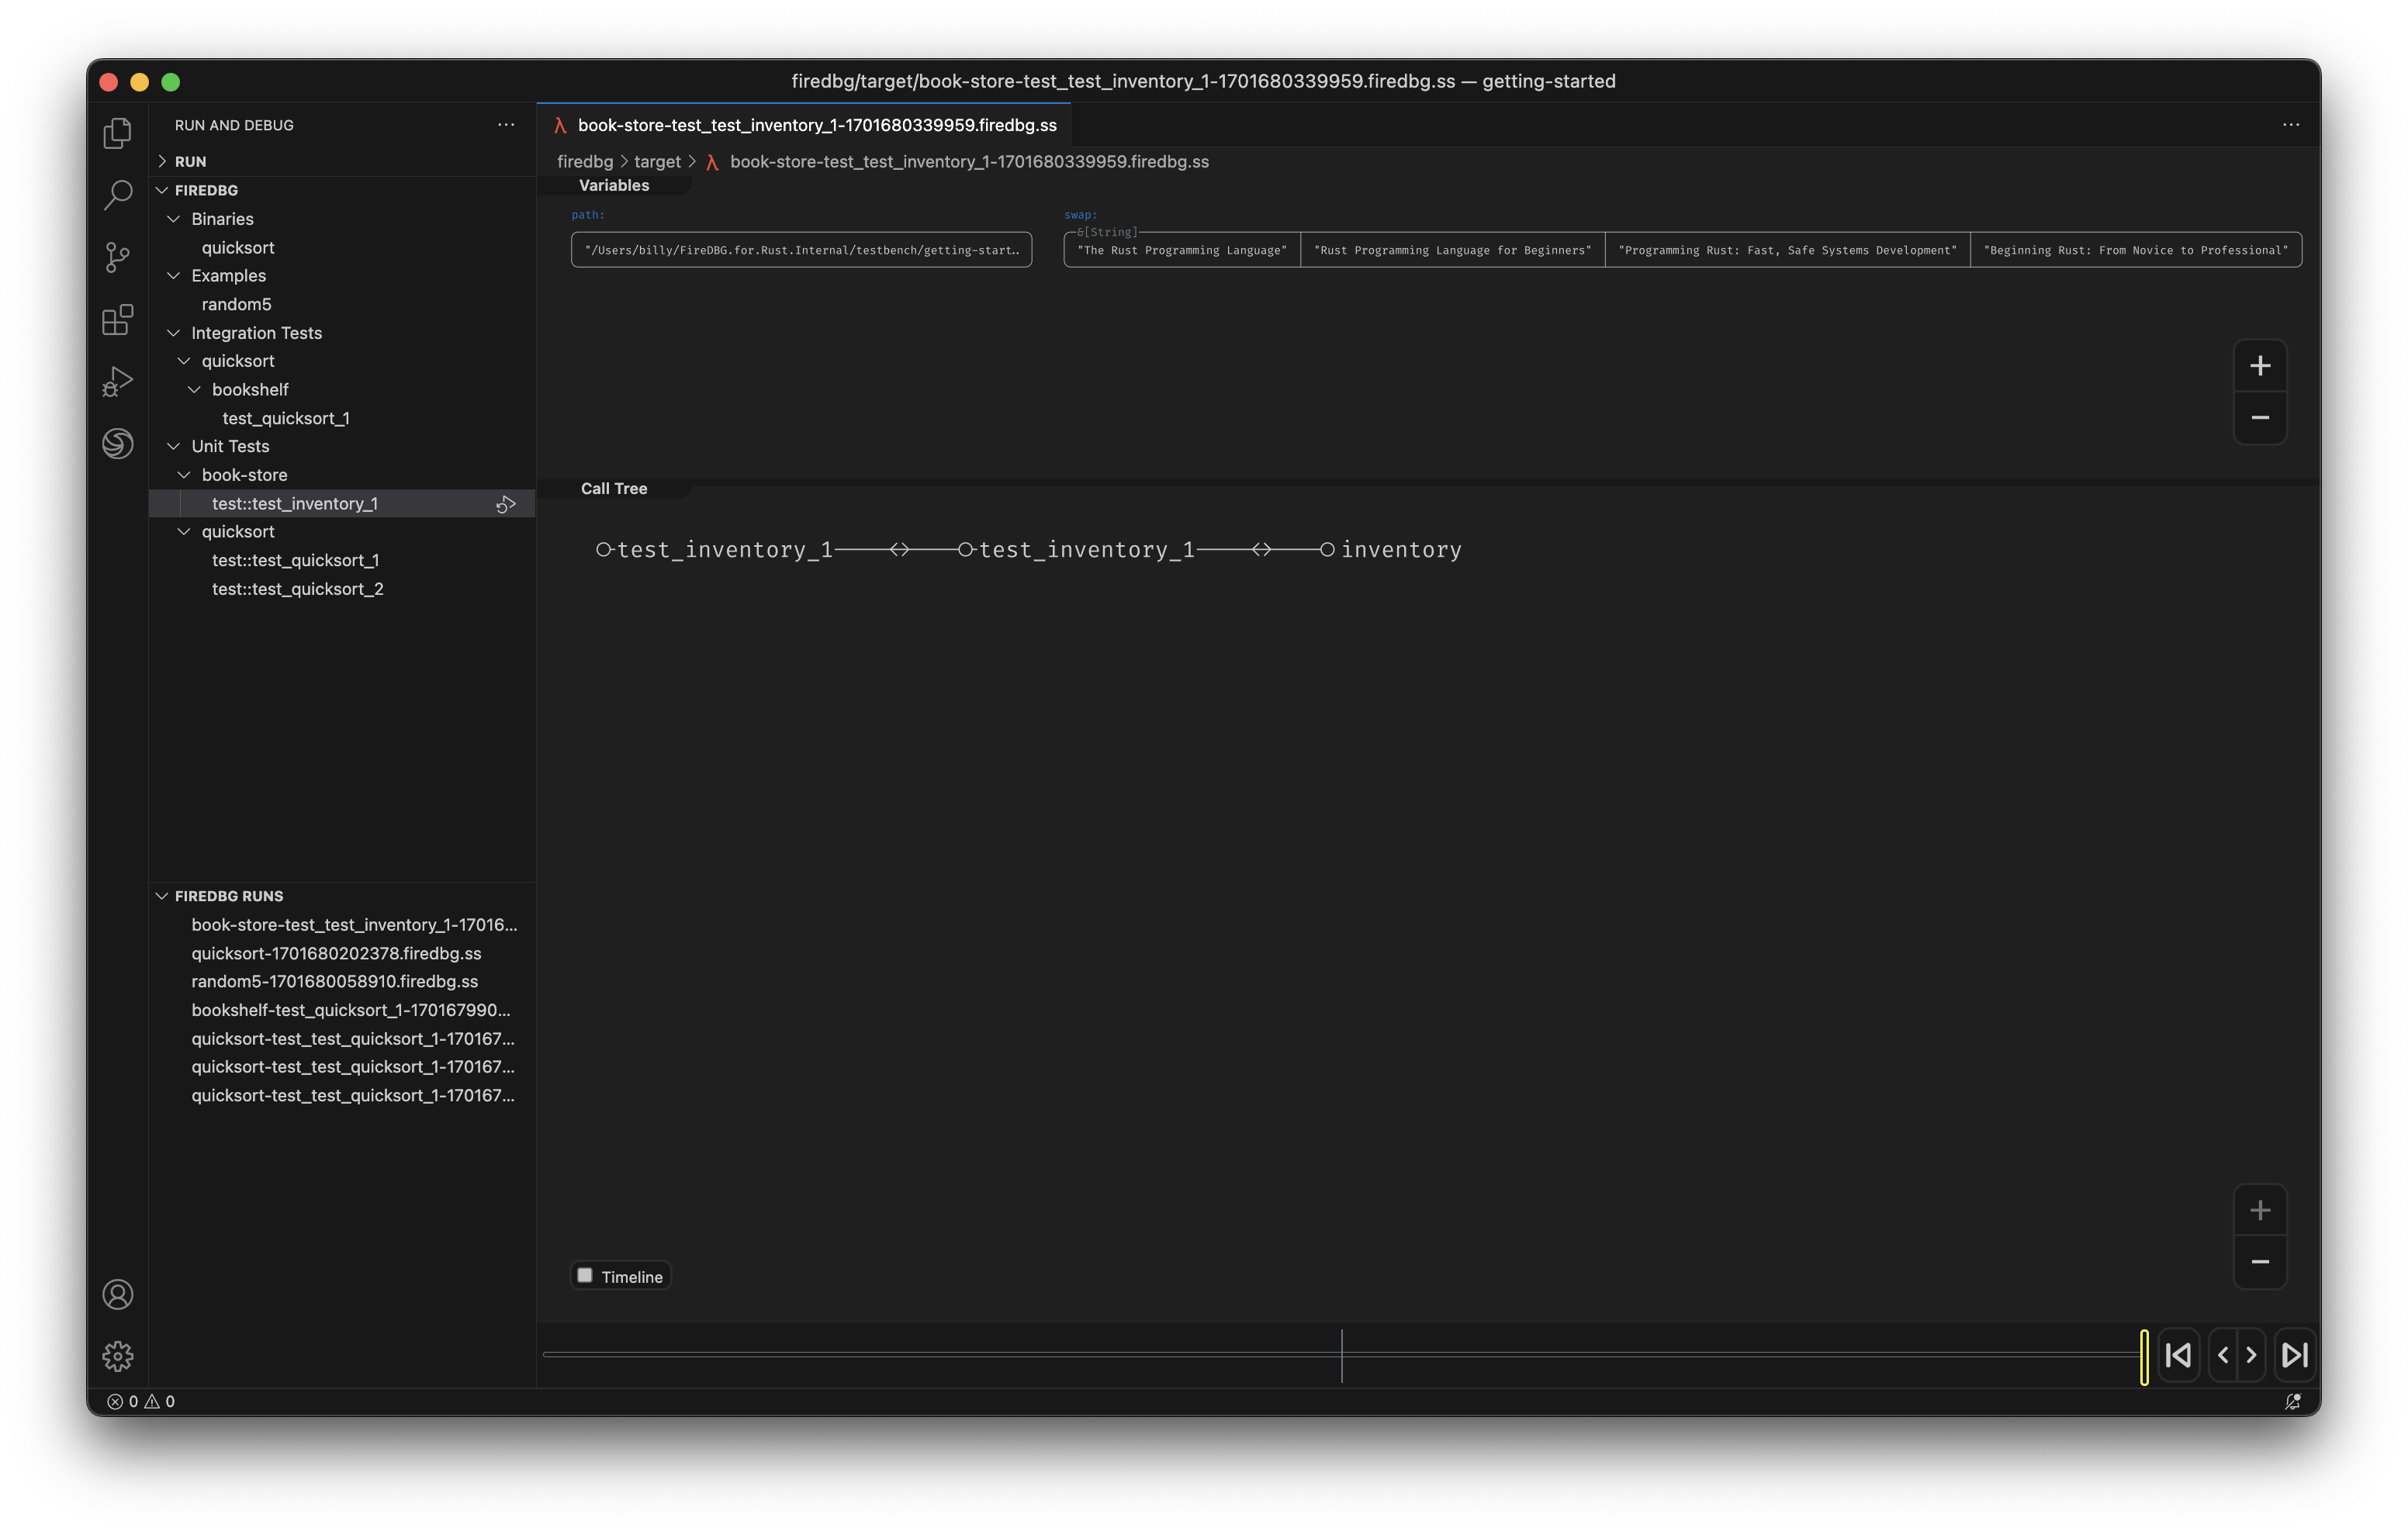
By default FireDBG will only trace the functions of the debug target.
If you want to trace other crates in your local workspace, you will need to create a firedbg.toml config file in your workspace root.
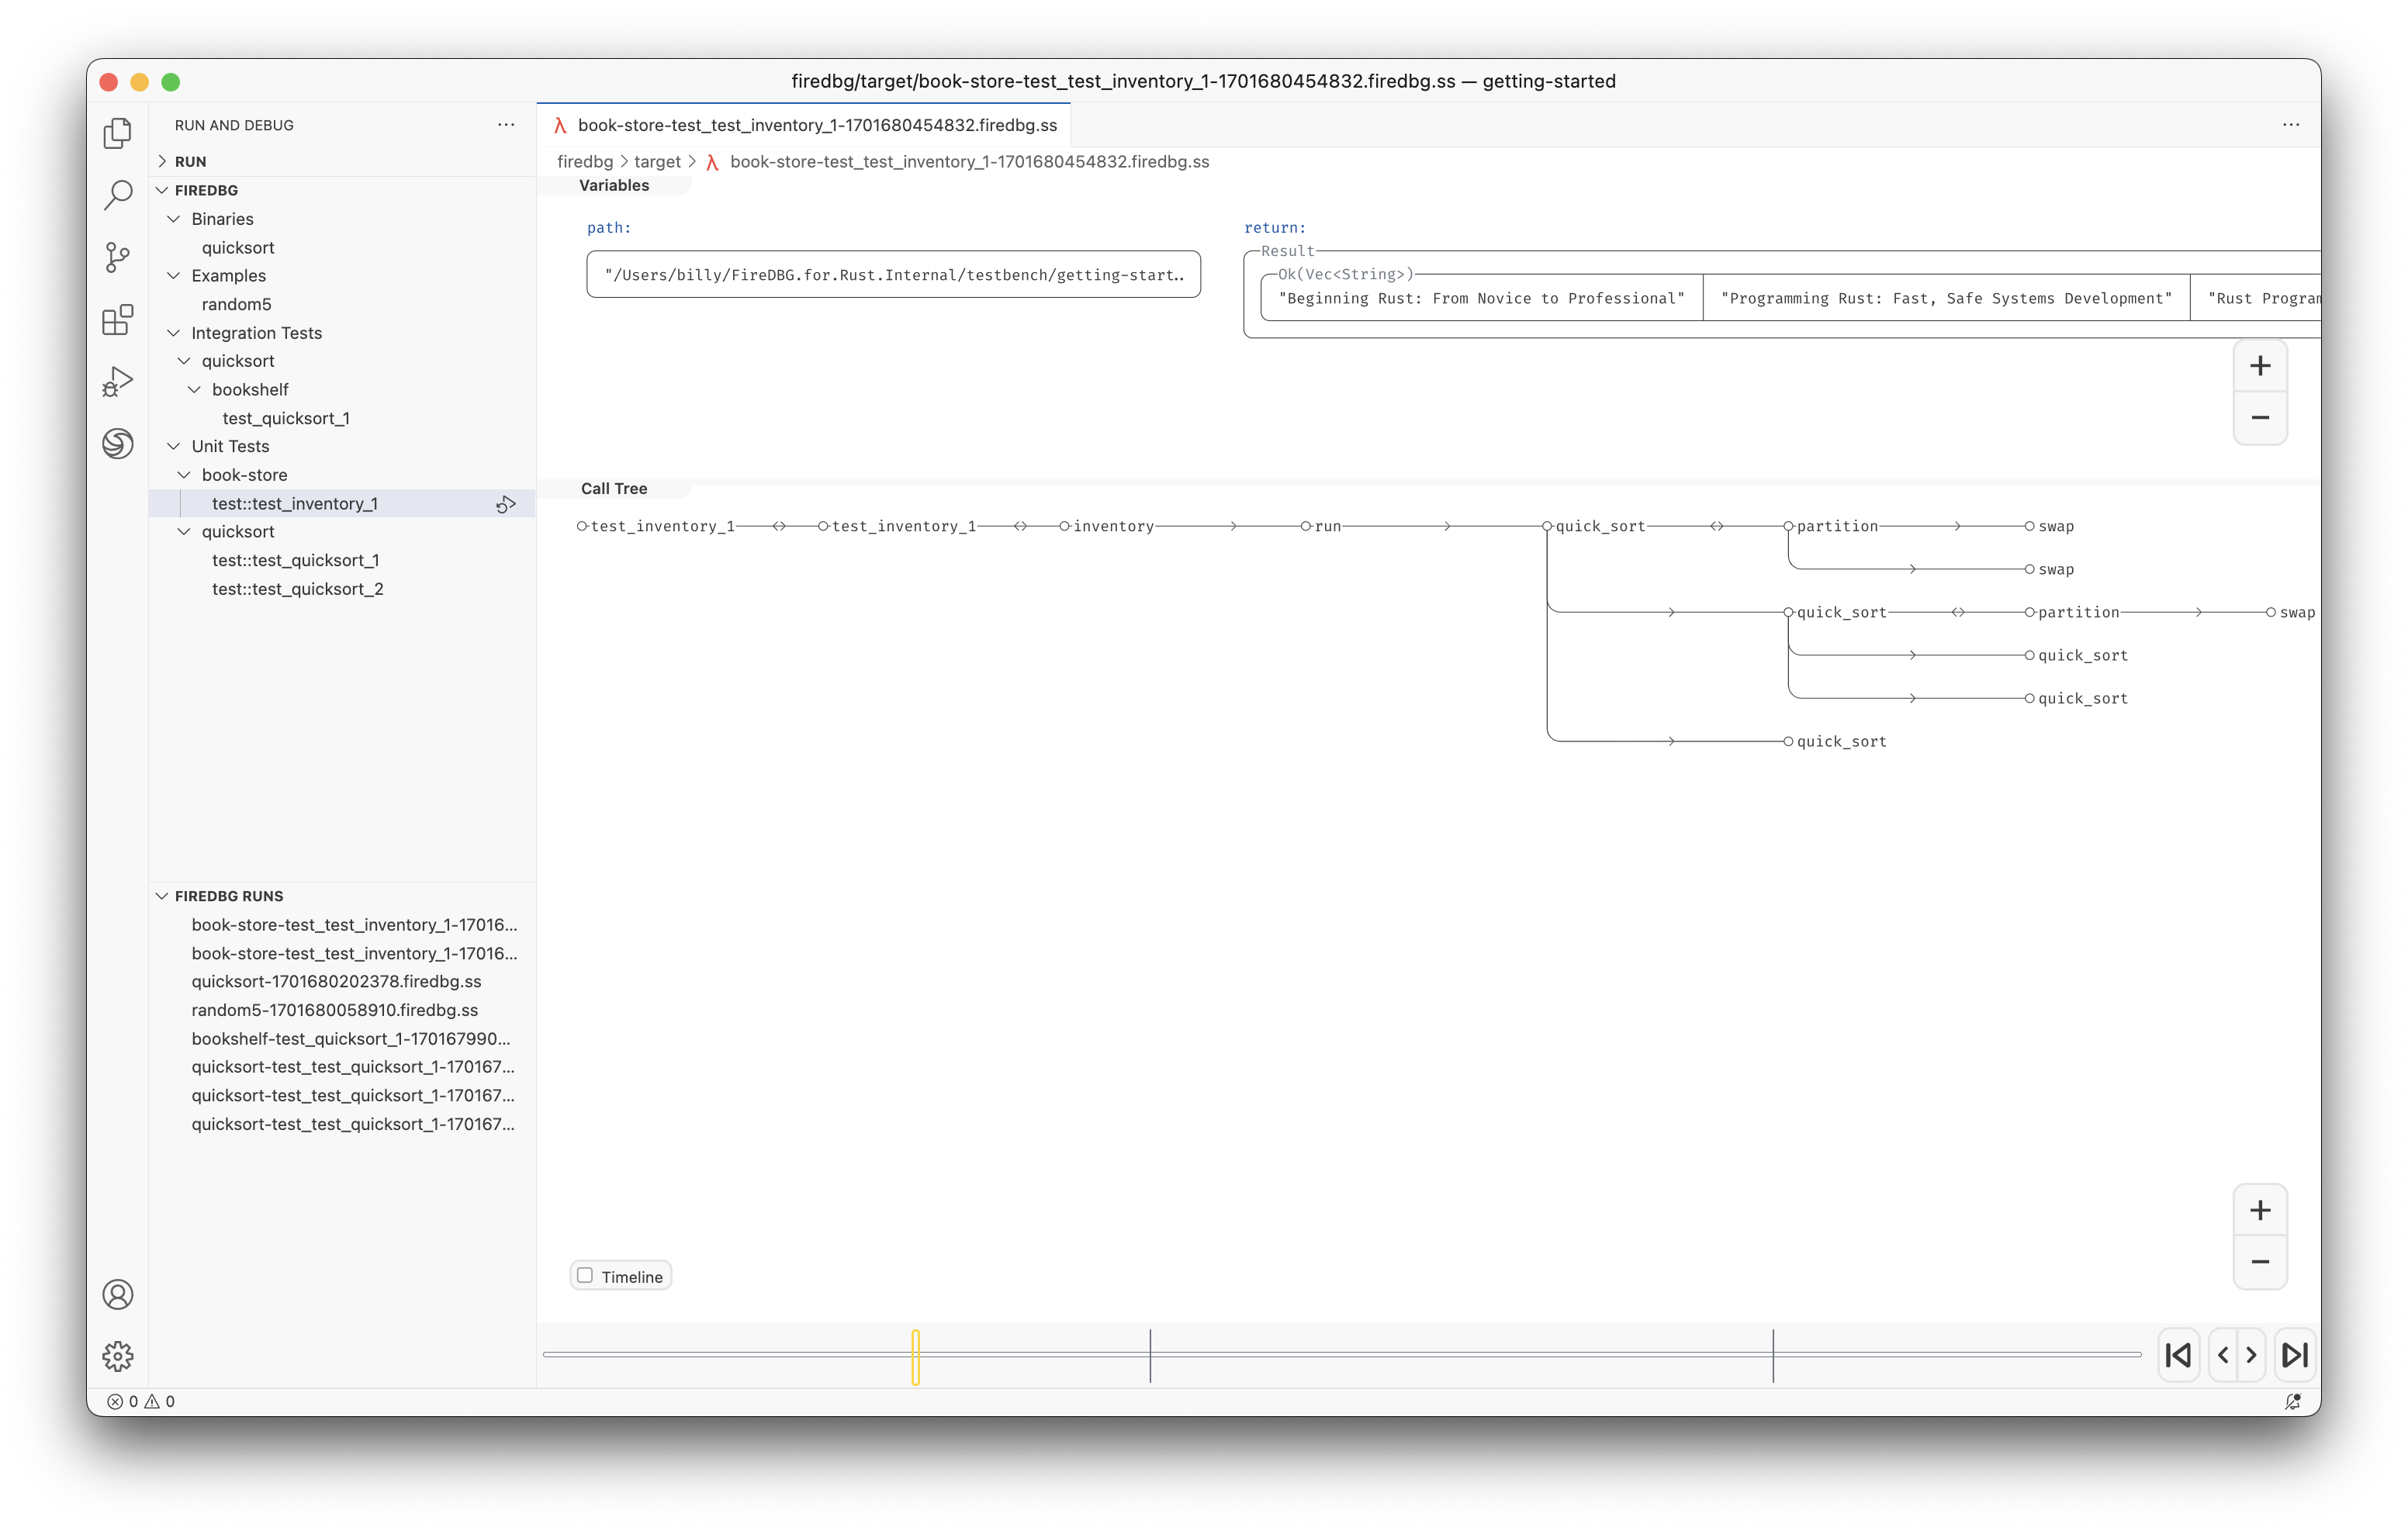
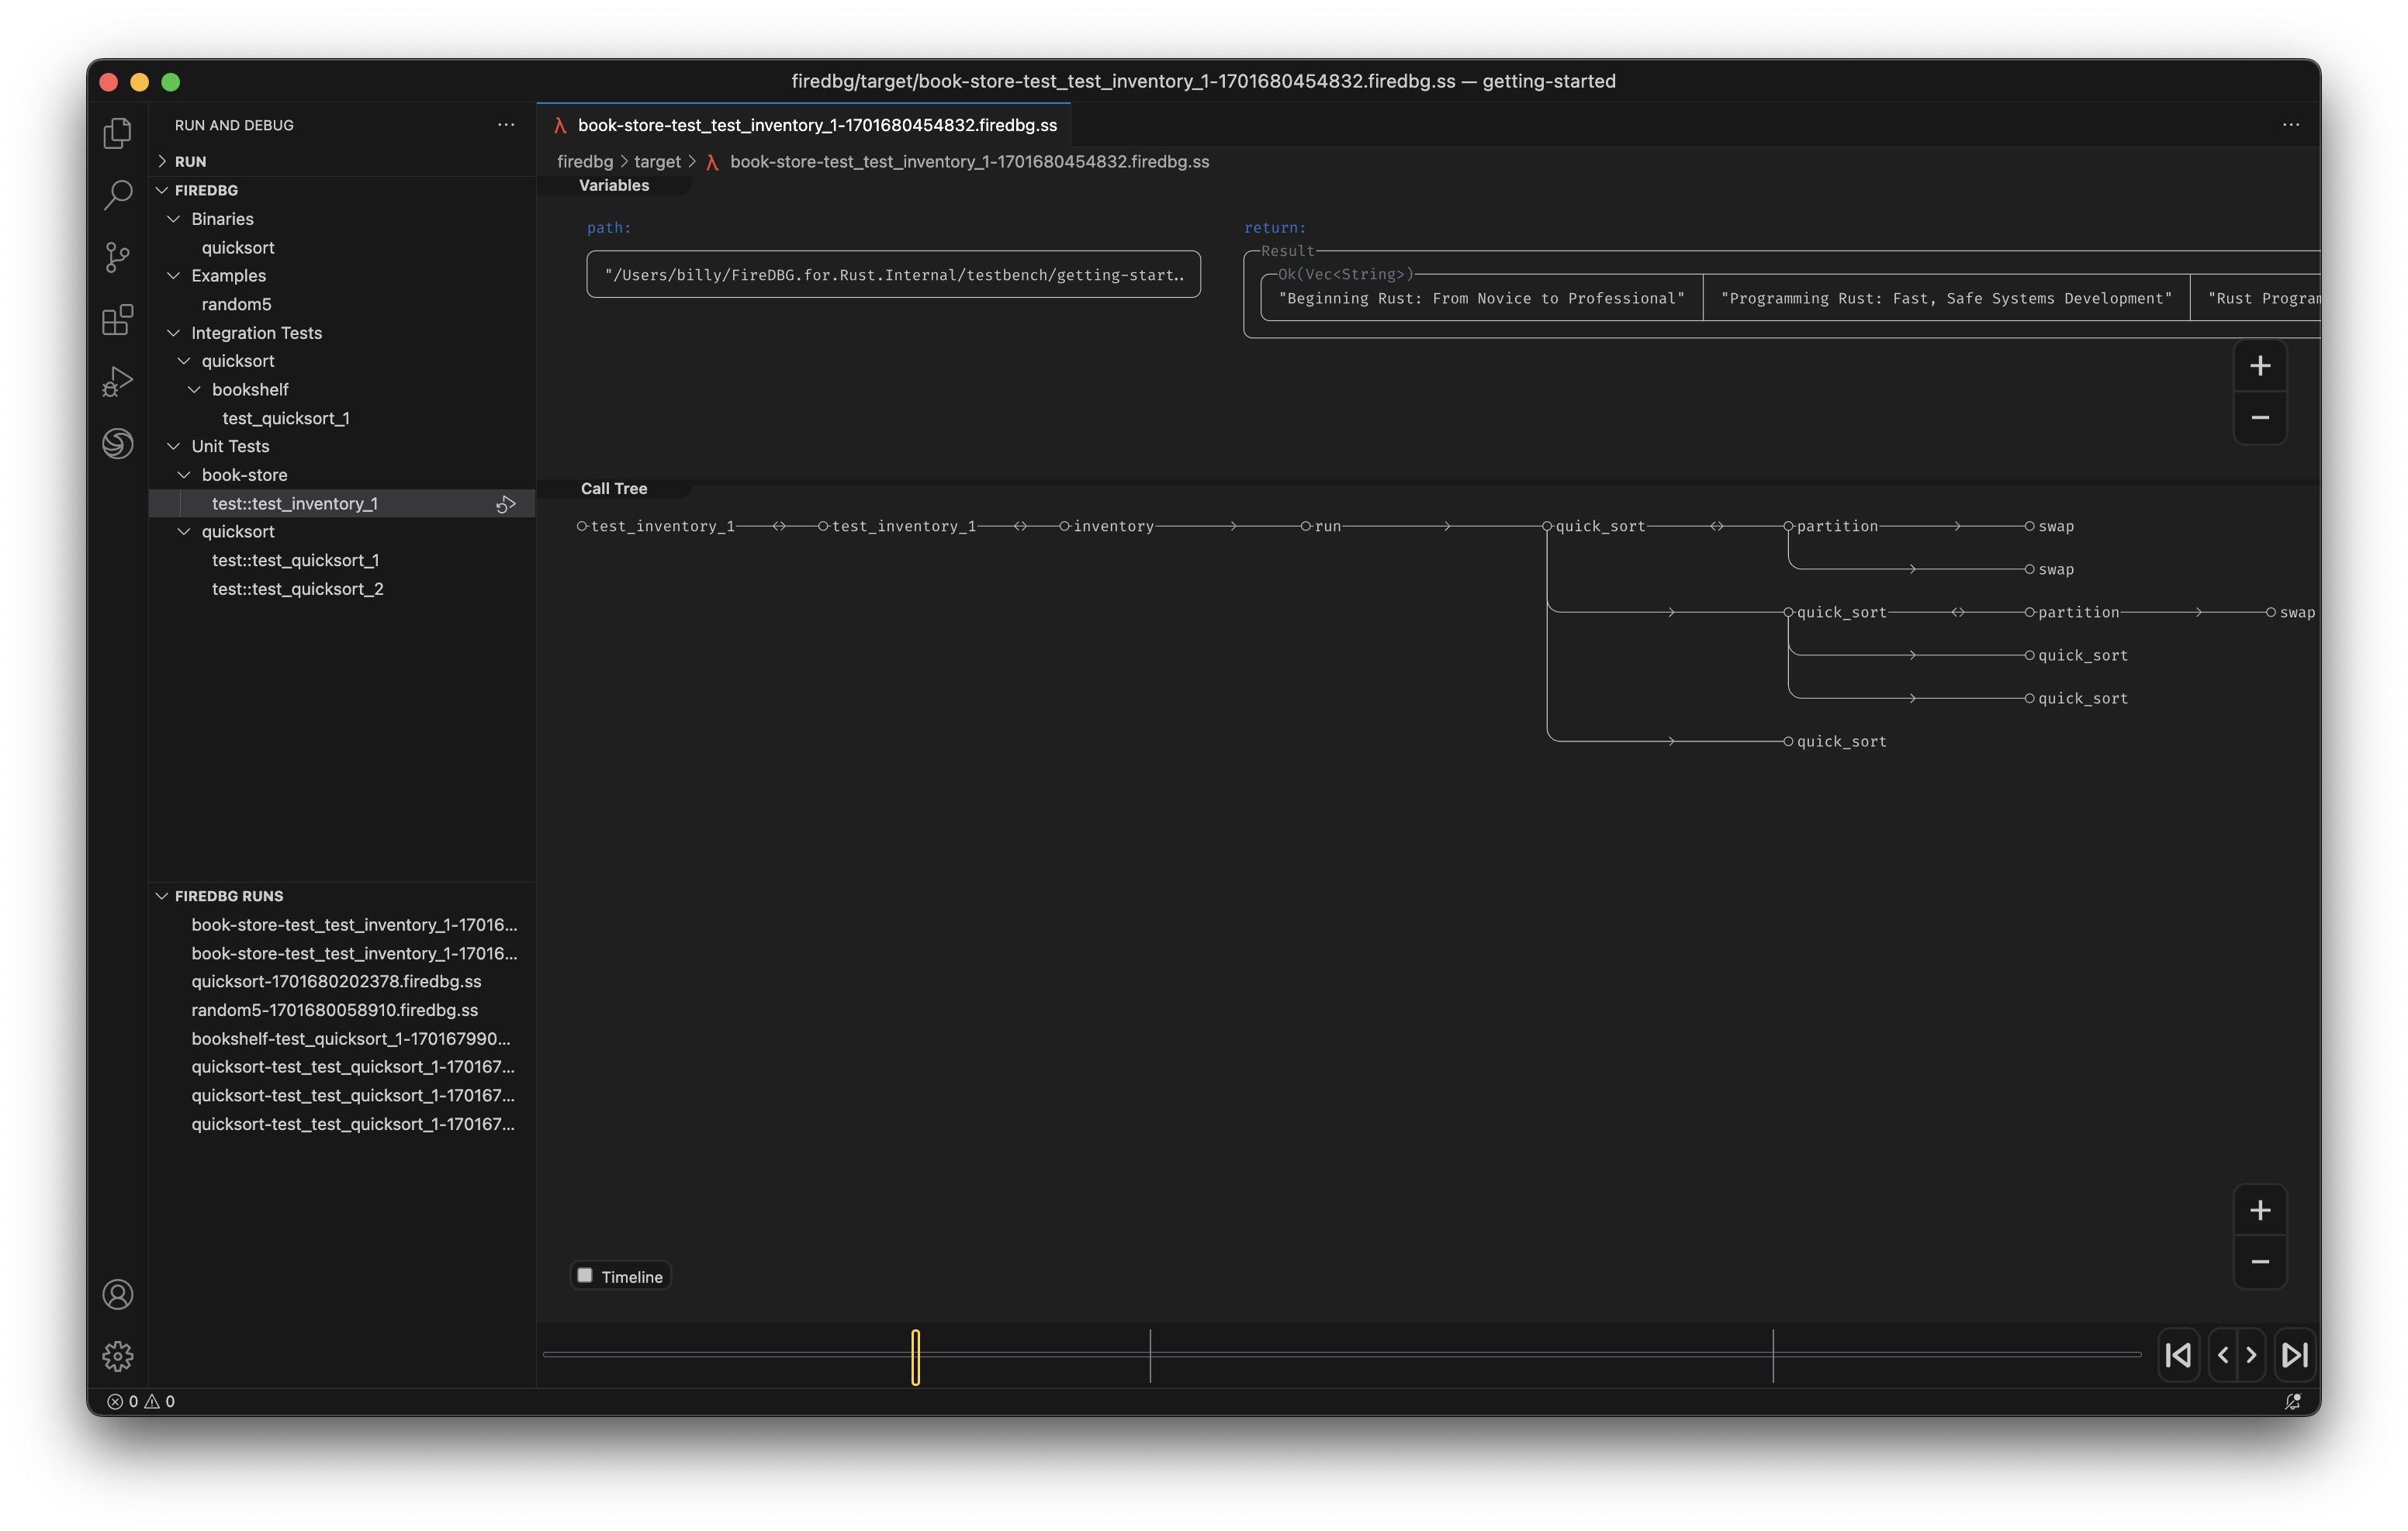
[workspace.members]
quicksort = { trace = "full" }
# Syntax: <PACKAGE> = { trace = "<full | none>" }
Now, we can see the function calls of the quicksort crate!
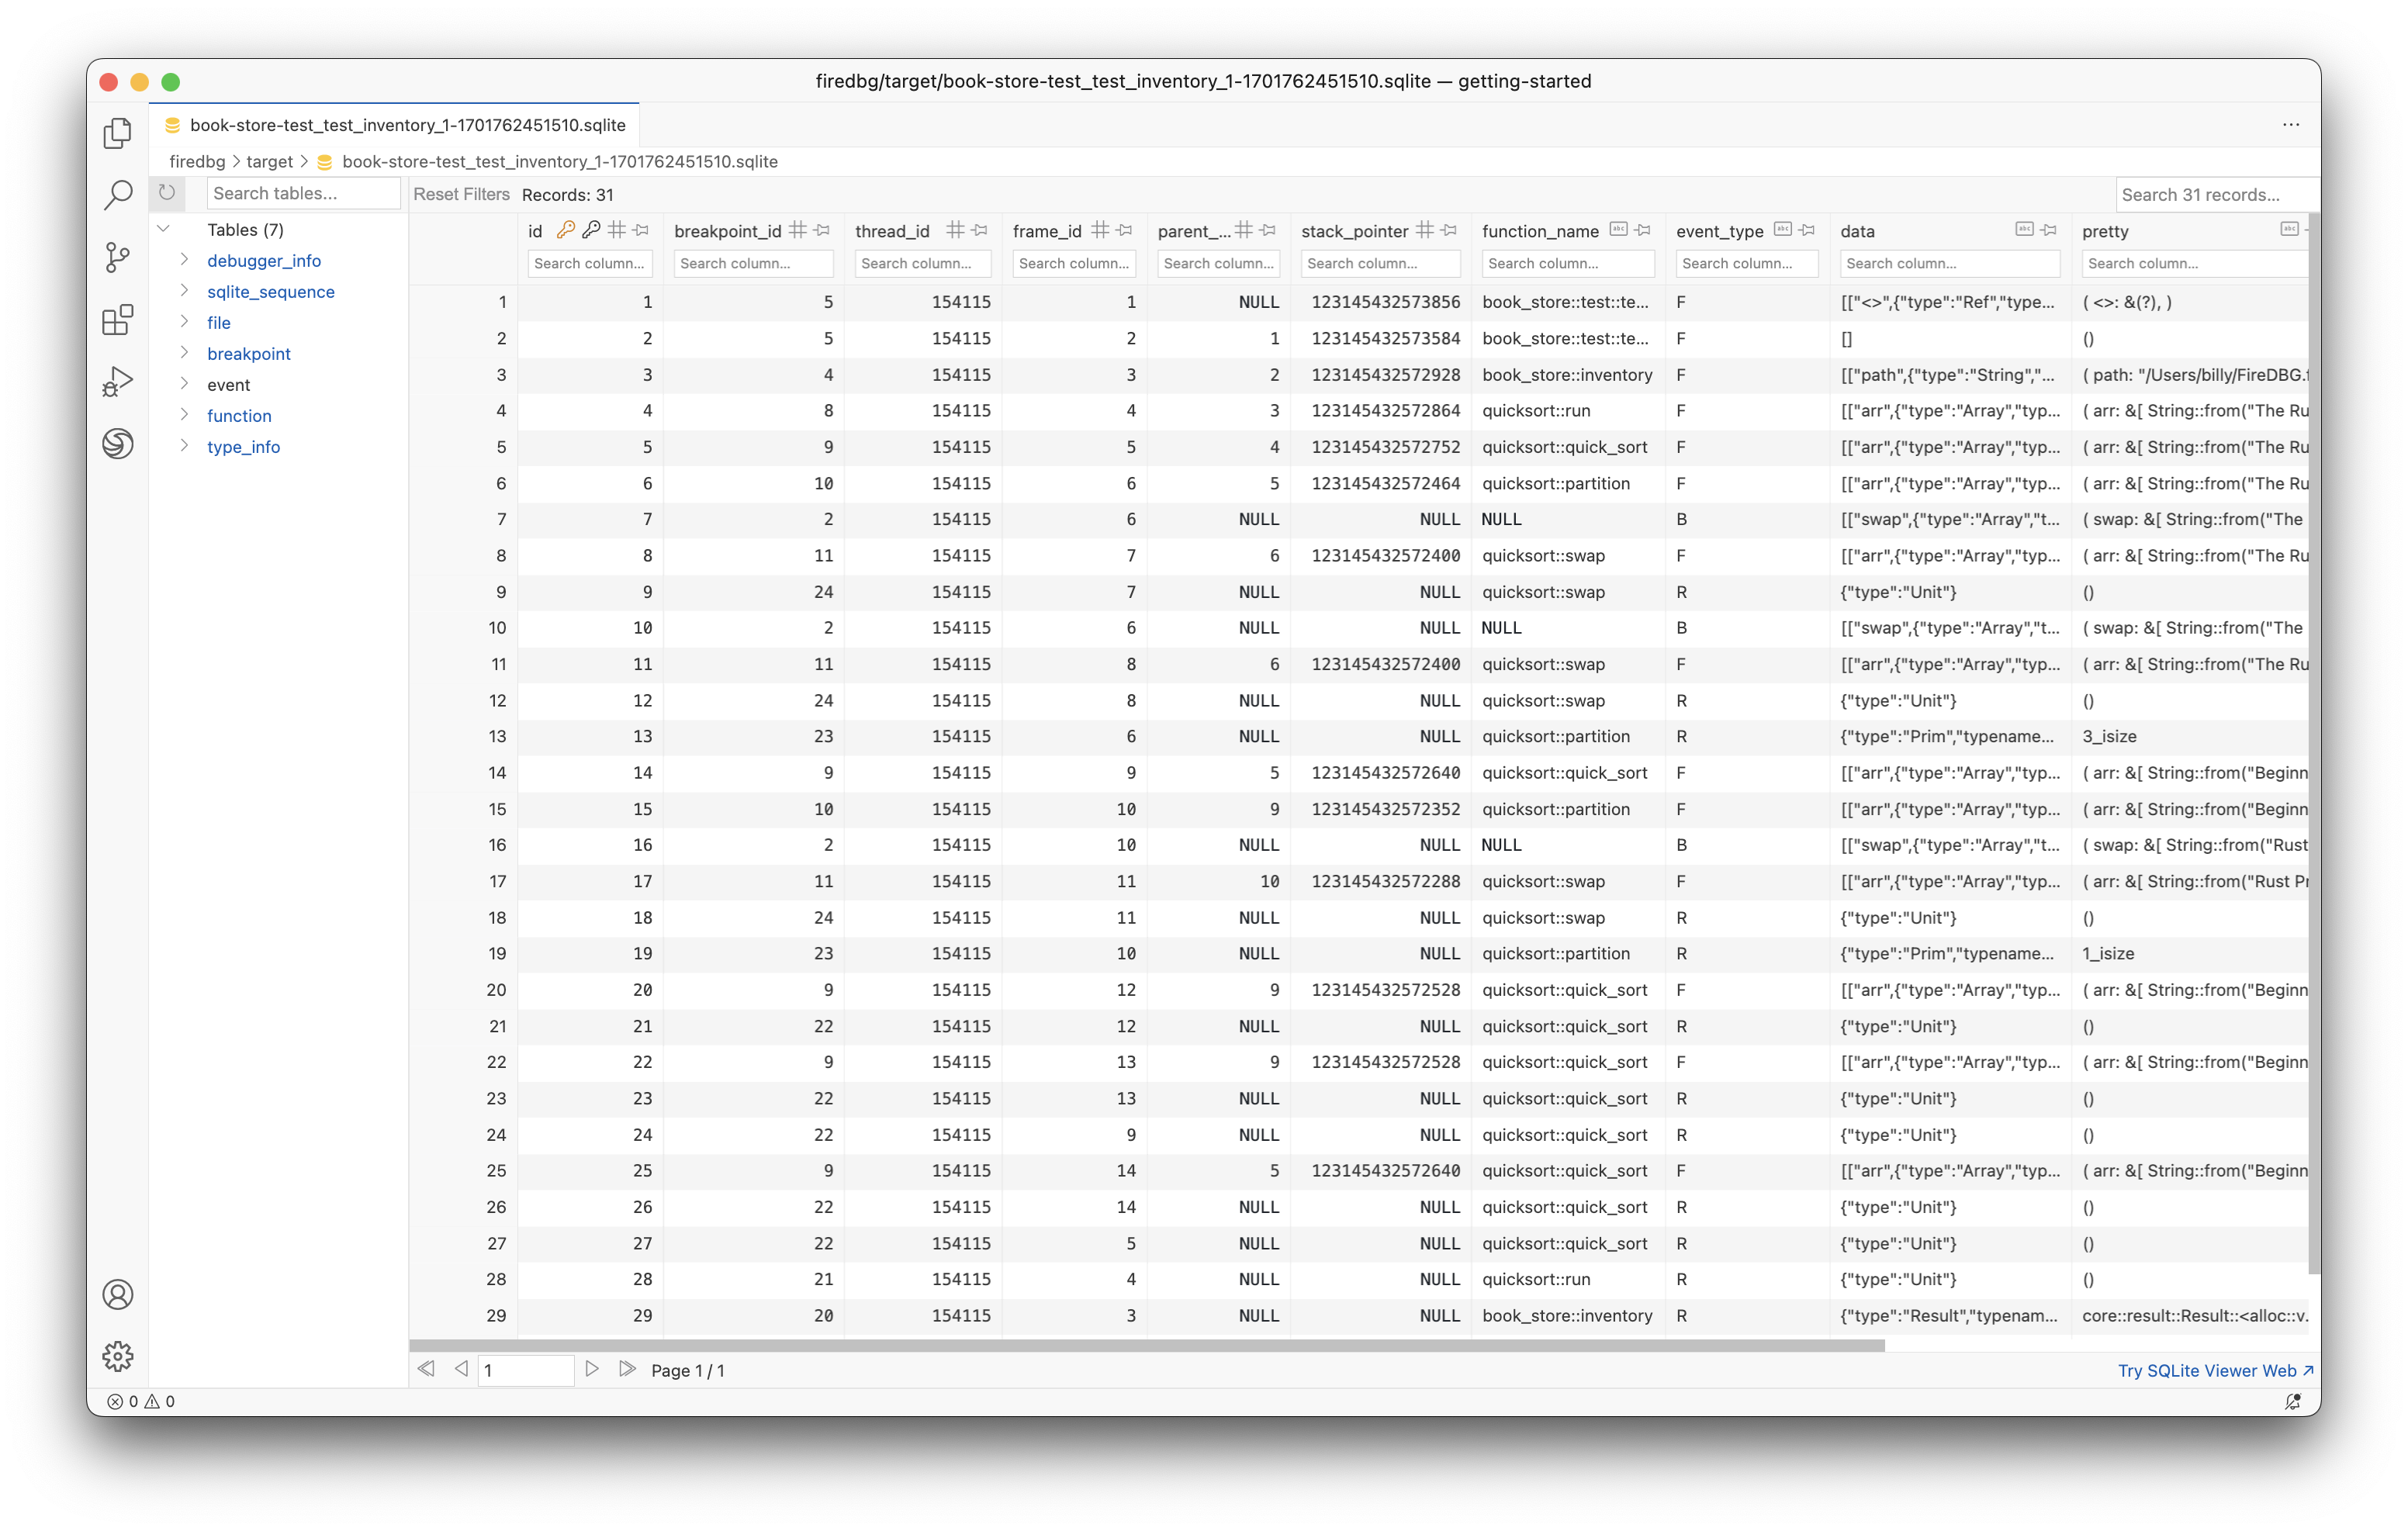
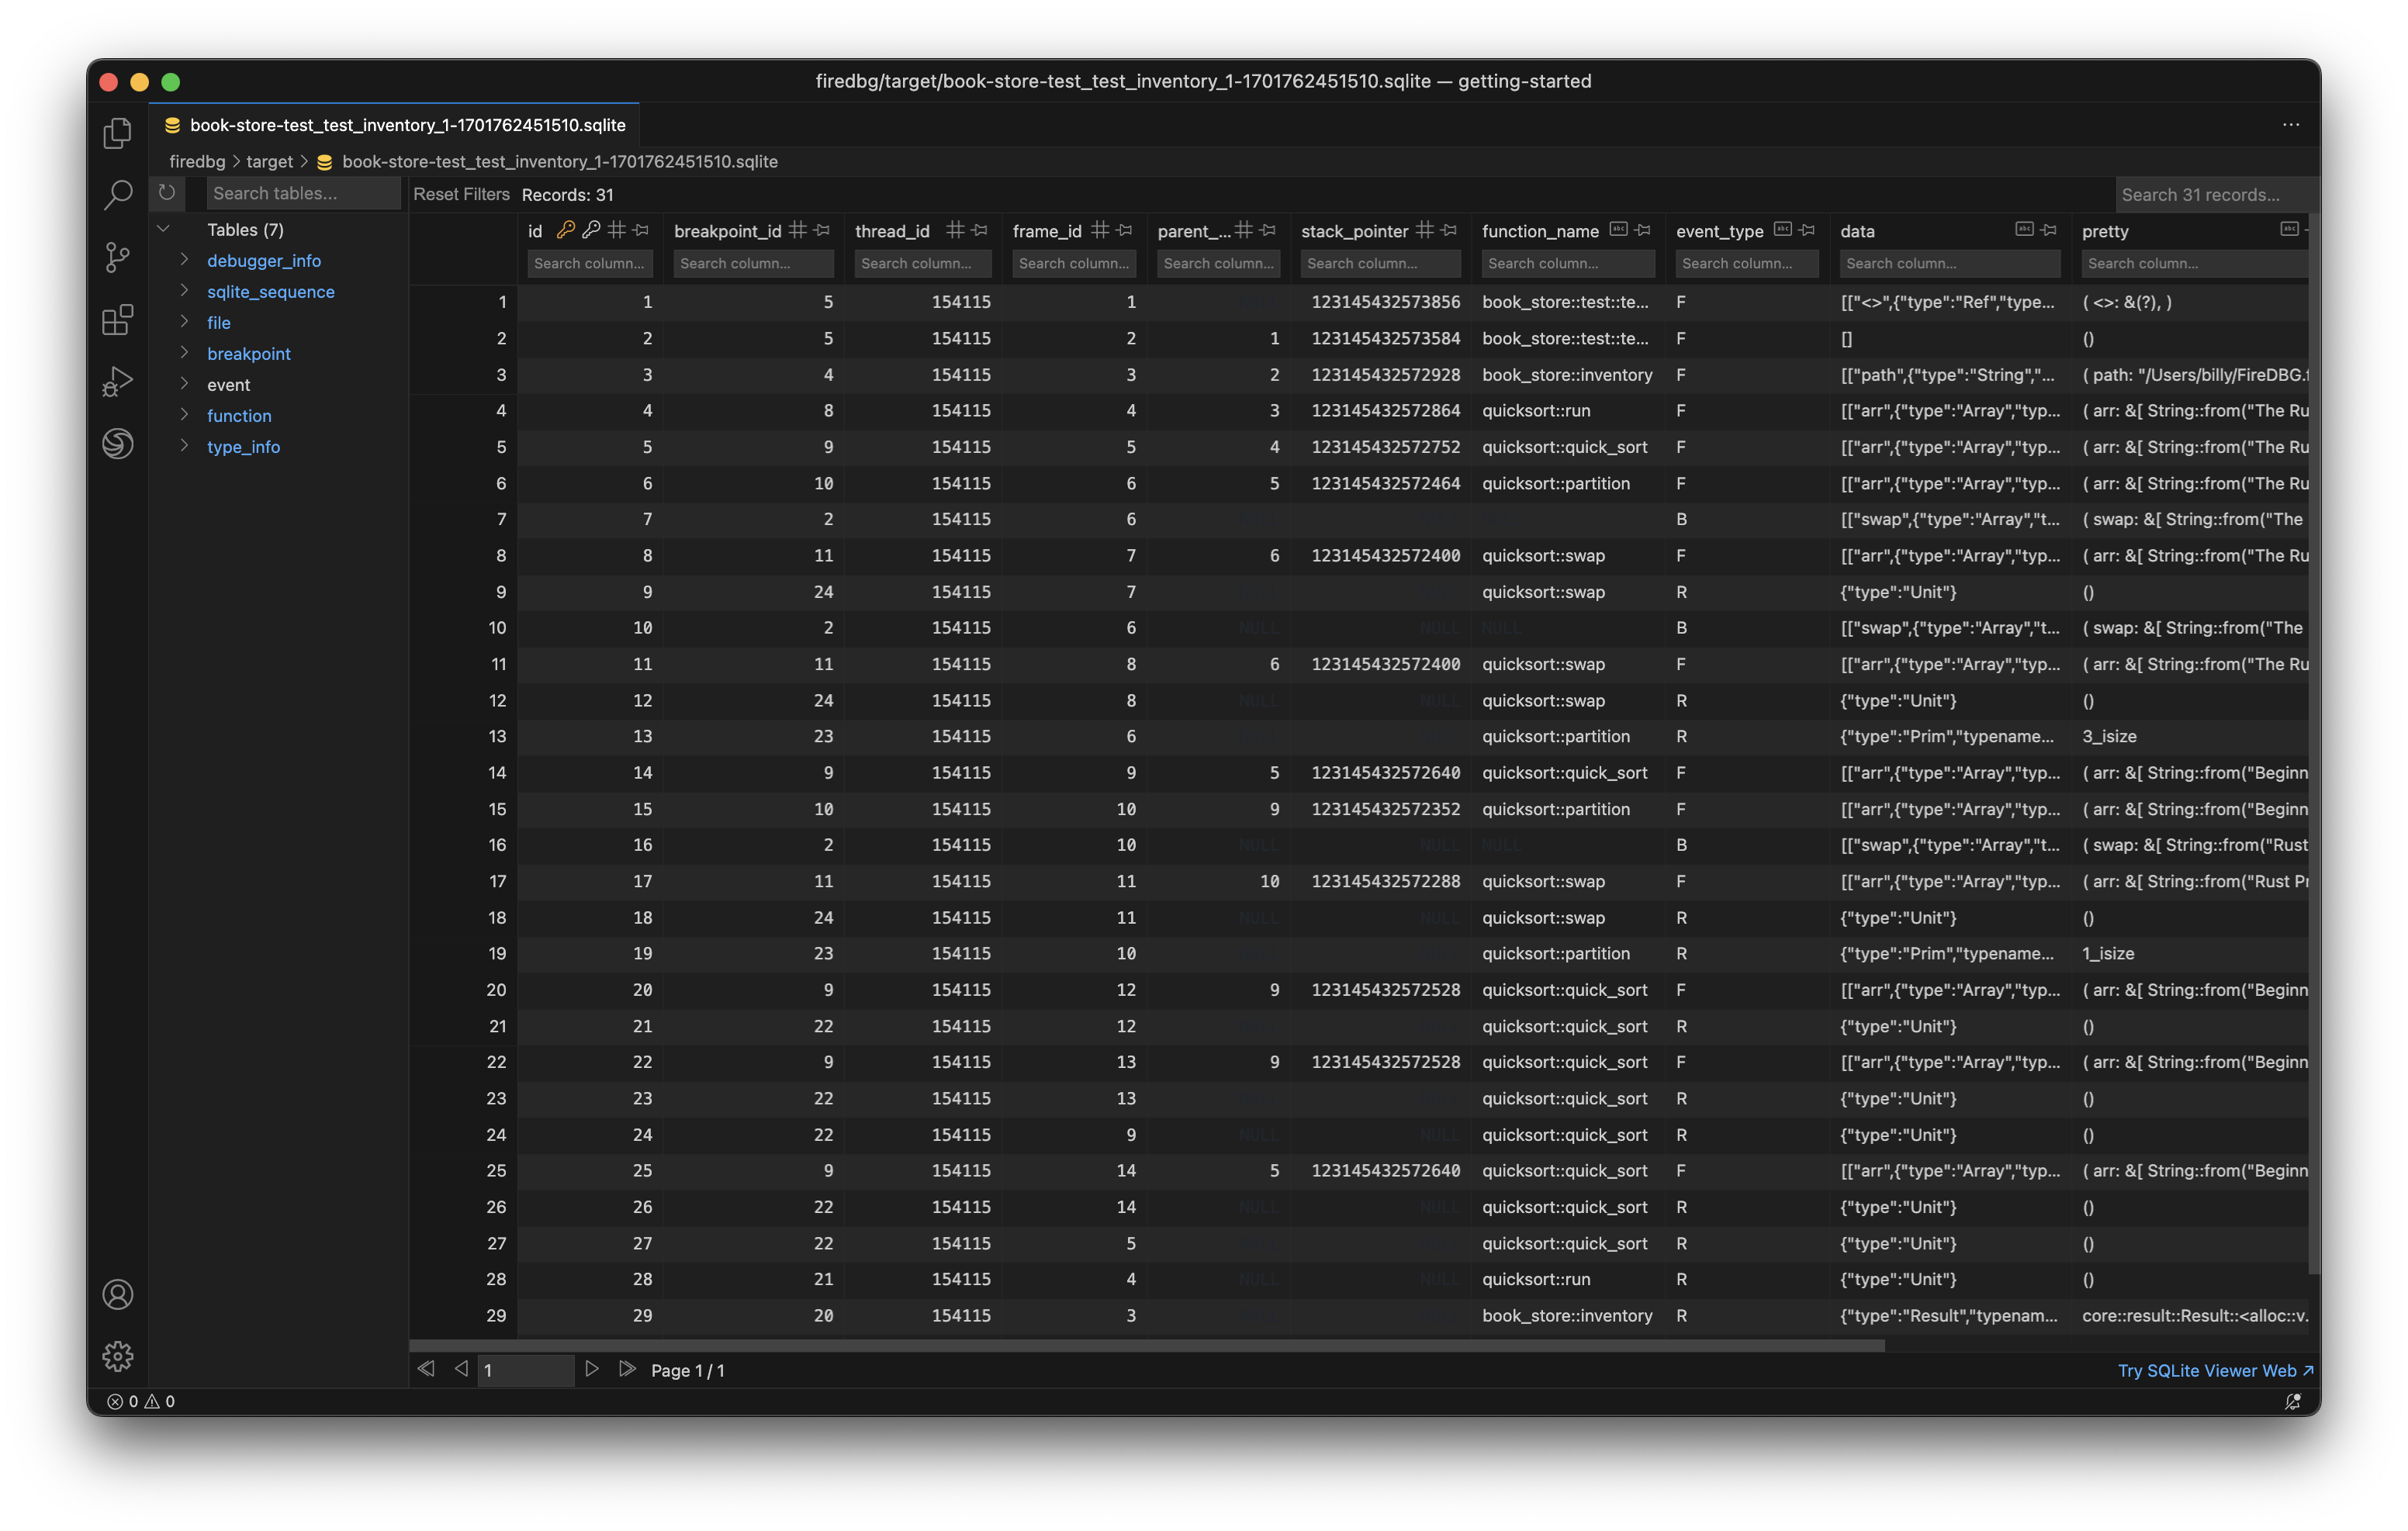
The Event Index
When you open a .firedbg.ss file, FireDBG indexer will create a .sqlite file to store the analyzed debug info.
You can also run the indexer manually with the firedbg index sub-command. You can now write SQL queries to your heart's content!