This post serves as the "Part 3" of the article "The rainbow bridge between sync and async Rust", today we will discuss:
- The fundamentals of multithreaded programming
- Synchronization with zero-sized channels
- Visualizing multithreaded programs with FireDBG
I've been thinking of the simplest program that can demonstrate the use of zero-sized channels in a multithreaded context, and no programming exercise can be simpler than FizzBuzz!
Problem
Here is the original description of the problem:
Write a program that prints the numbers from 1 to 100.
But for multiples of three print "Fizz" instead of the number and for the multiples of five print "Buzz".
For numbers which are multiples of both three and five print "FizzBuzz".
With an additional requirement:
Fizz and Buzz must be printed from different threads.
To keep things simple, the printing of numbers and Fizz can happen on the same thread. So we only need two threads for this problem.
Let's look at the basic solution to the original FizzBuzz problem:
fn main() {
    for i in 1..=100 {
        if i % 15 == 0 {
            println!("FizzBuzz");
        } else if i % 3 == 0 {
            println!("Fizz");
        } else if i % 5 == 0 {
            println!("Buzz");
        } else {
            println!("{i}");
        }
    }
}
It prints something like:
1
2
Fizz
4
Buzz
Fizz
7
8
Fizz
Buzz
11
Fizz
13
14
FizzBuzz
16
17
Fizz
19
Buzz
Fizz
22
23
Fizz
Buzz
26
Fizz
28
29
FizzBuzz
...
Multi-thread
We want to move Buzz to a different thread. Let's take a closer look to the core logic:
if i % 15 == 0 {
    print!("Fizz");
    println!("Buzz"); // <- move this to a different thread
} else if i % 3 == 0 {
    println!("Fizz");
} else if i % 5 == 0 {
    println!("Buzz"); // <- also move this
} else {
    println!("{i}");
}
Here is where channels come into play. We want to notify the other thread - "hey it's time for you to buzz!".
We want to use a "zero-sized" channel, because we want our Fizz thread to wait until the Buzz thread is ready to print.
The SyncSender::send() method is blocking, i.e.
This function will block until space in the internal buffer becomes available or a receiver is available to hand off the message to.
If the buffer size is 0, however, the channel becomes a rendezvous channel and it guarantees that the receiver has indeed received the data if this function returns success.
Because there is only one thing we need to notify, we can send () - the zero-sized type.
Based on the examples in the previous post, we can try construct the following:
use std::sync::mpsc::{sync_channel, Receiver, SyncSender};

fn fizzer(sender: SyncSender<()>) {
    for i in 1..=100 {
        if i % 15 == 0 {
            print!("Fizz");
            sender.send(()).unwrap();
        } else if i % 3 == 0 {
            println!("Fizz");
        } else if i % 5 == 0 {
            sender.send(()).unwrap();
        } else {
            println!("{i}");
        }
    }
}

fn buzzer(receiver: Receiver<()>) {
    while let Ok(()) = receiver.recv() {
        println!("Buzz");
    }
}

fn main() {
    let (sender, receiver) = sync_channel(0); // zero sized
    std::thread::spawn(move || buzzer(receiver));

    fizzer(sender);
}
Race condition
Neat, this should work right? Let's give it a try. Since this is a multi-threaded program, let's run it a few times:
| 1st | 2nd | 3rd |
|---|---|---|
| 1 2 Fizz 4 Buzz Fizz 7 8 Fizz 11 Fizz Buzz 13 14 Fizz16 17 Fizz 19 Buzz Buzz | 1 2 Fizz 4 Buzz Fizz 7 8 Fizz 11 Fizz 13 14 FizzBuzz Buzz 16 17 Fizz 19 Fizz | 1 2 Fizz 4 Buzz Fizz 7 8 Fizz 11 Fizz 13 Buzz 14 Fizz16 17 Fizz 19 Buzz Buzz |
Sad, it doesn't look deterministic. The first Buzz is in the right place, but subsequent Buzzes are in the wrong places. There are ... race conditions!
But why?
Here is what should have happened:
1: Fizz thread sends a signal
2: Buzz thread receives a signal
3: Buzz prints
4: Fizz thread continues running
5. Print other numbers
Here is what could have happened:
1: Fizz thread sends a signal
2: Buzz thread receives a signal
4: Fizz thread continues running
5. Print other numbers
3: Buzz prints
Turns out, the channel and signal only guarantees the relative order of 1 and 2, but everything afterwards can happen in arbitrary order!
This is the rule of thumb of multithreaded / parallel programming: if we don't make explicit attempt to synchronize different actors, we cannot assume things will happen in a particular order.
Solution
The solution to the above problem is simple: Fizz thread has to wait until Buzz thread finishes printing. There can be multiple ways to implement this, e.g. with a request-response design, or with a Future that only completes after printing.
The simplest solution here, though, is to send signals in successive pairs, with even signals indicating an open ( and odd signals indicating a close ).
use std::sync::mpsc::{sync_channel, Receiver, SyncSender};

fn fizzer(sender: SyncSender<()>) {
    for i in 1..=100 {
        if i % 15 == 0 {
            print!("Fizz");
            sender.send(()).unwrap();
            sender.send(()).unwrap(); // <-
        } else if i % 3 == 0 {
            println!("Fizz");
        } else if i % 5 == 0 {
            sender.send(()).unwrap();
            sender.send(()).unwrap(); // <-
        } else {
            println!("{i}");
        }
    }
}

fn buzzer(receiver: Receiver<()>) {
    while let Ok(()) = receiver.recv() {
        println!("Buzz");
        receiver.recv().unwrap(); // <-
    }
}

fn main() {
    let (sender, receiver) = sync_channel(0);
    std::thread::spawn(move || buzzer(receiver));

    fizzer(sender);
}
There is no material transfer here, but the first rendezvous can be thought as "I hand over the lock to print now", and the second is thus "now return the print lock to me". Here () represents an imaginary lock.
If you think this is clever, subtle and intricate, you're right. Yes parallel programming can be intimidating and error-prone.
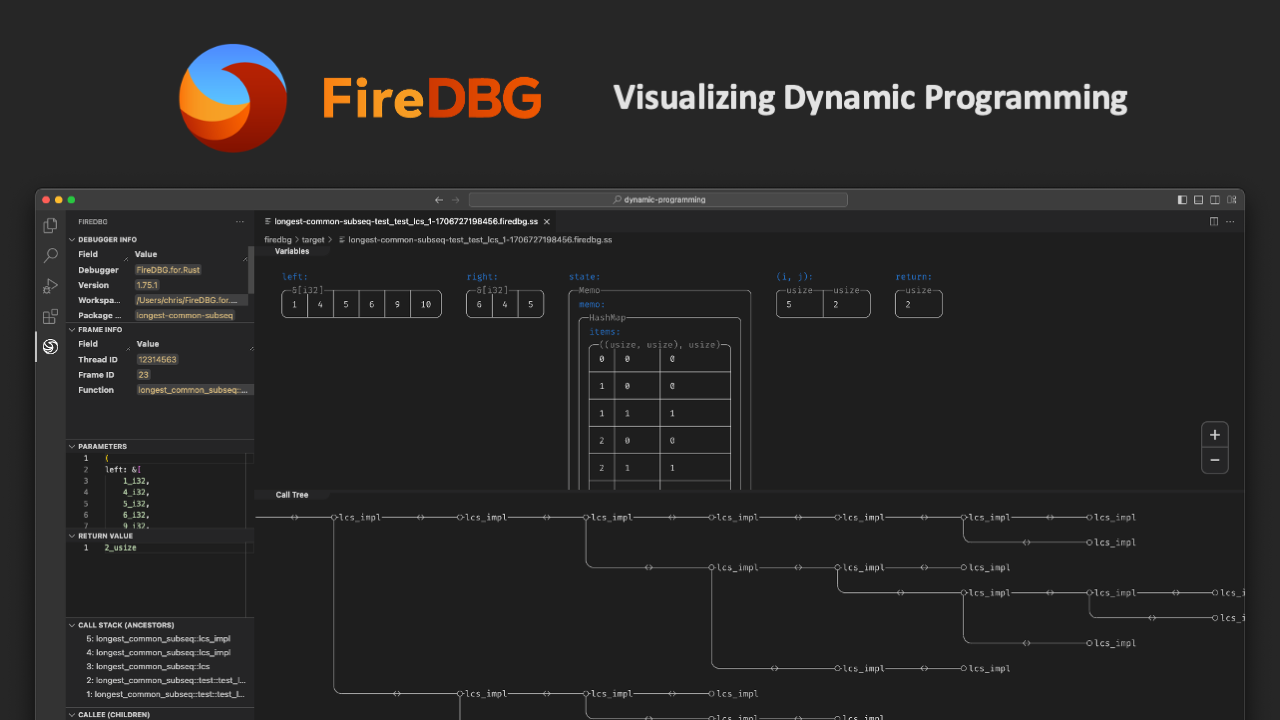
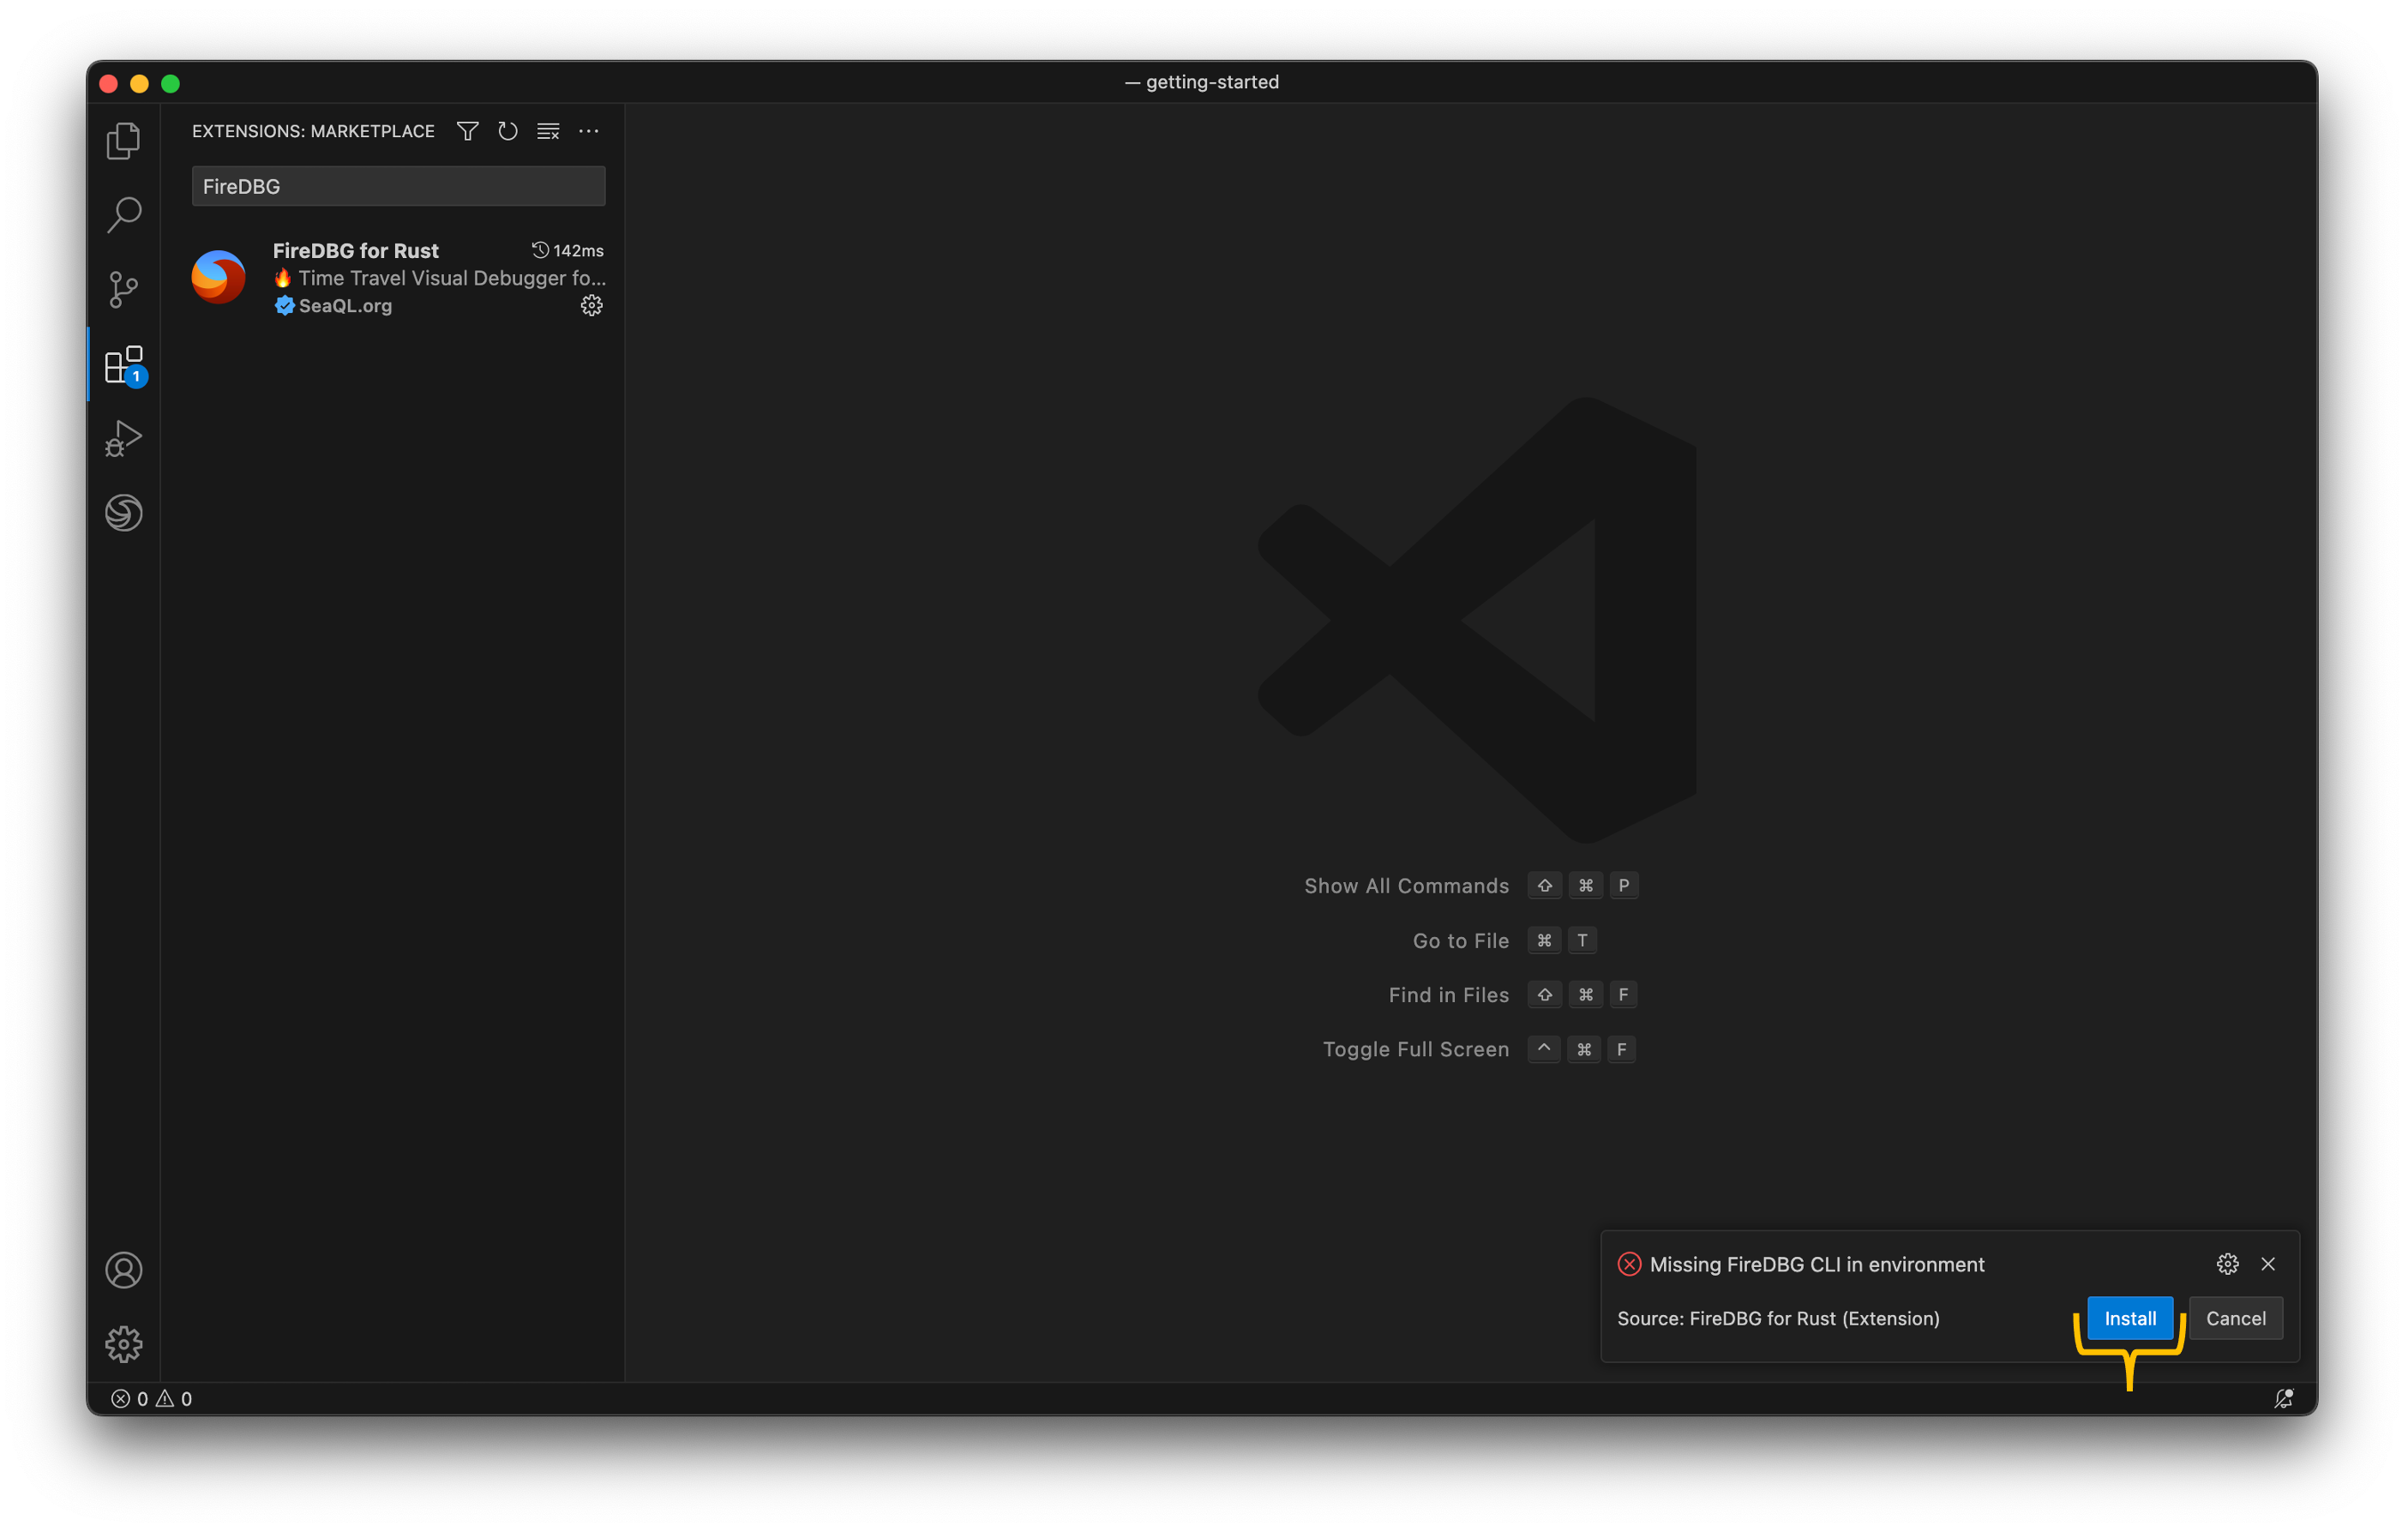
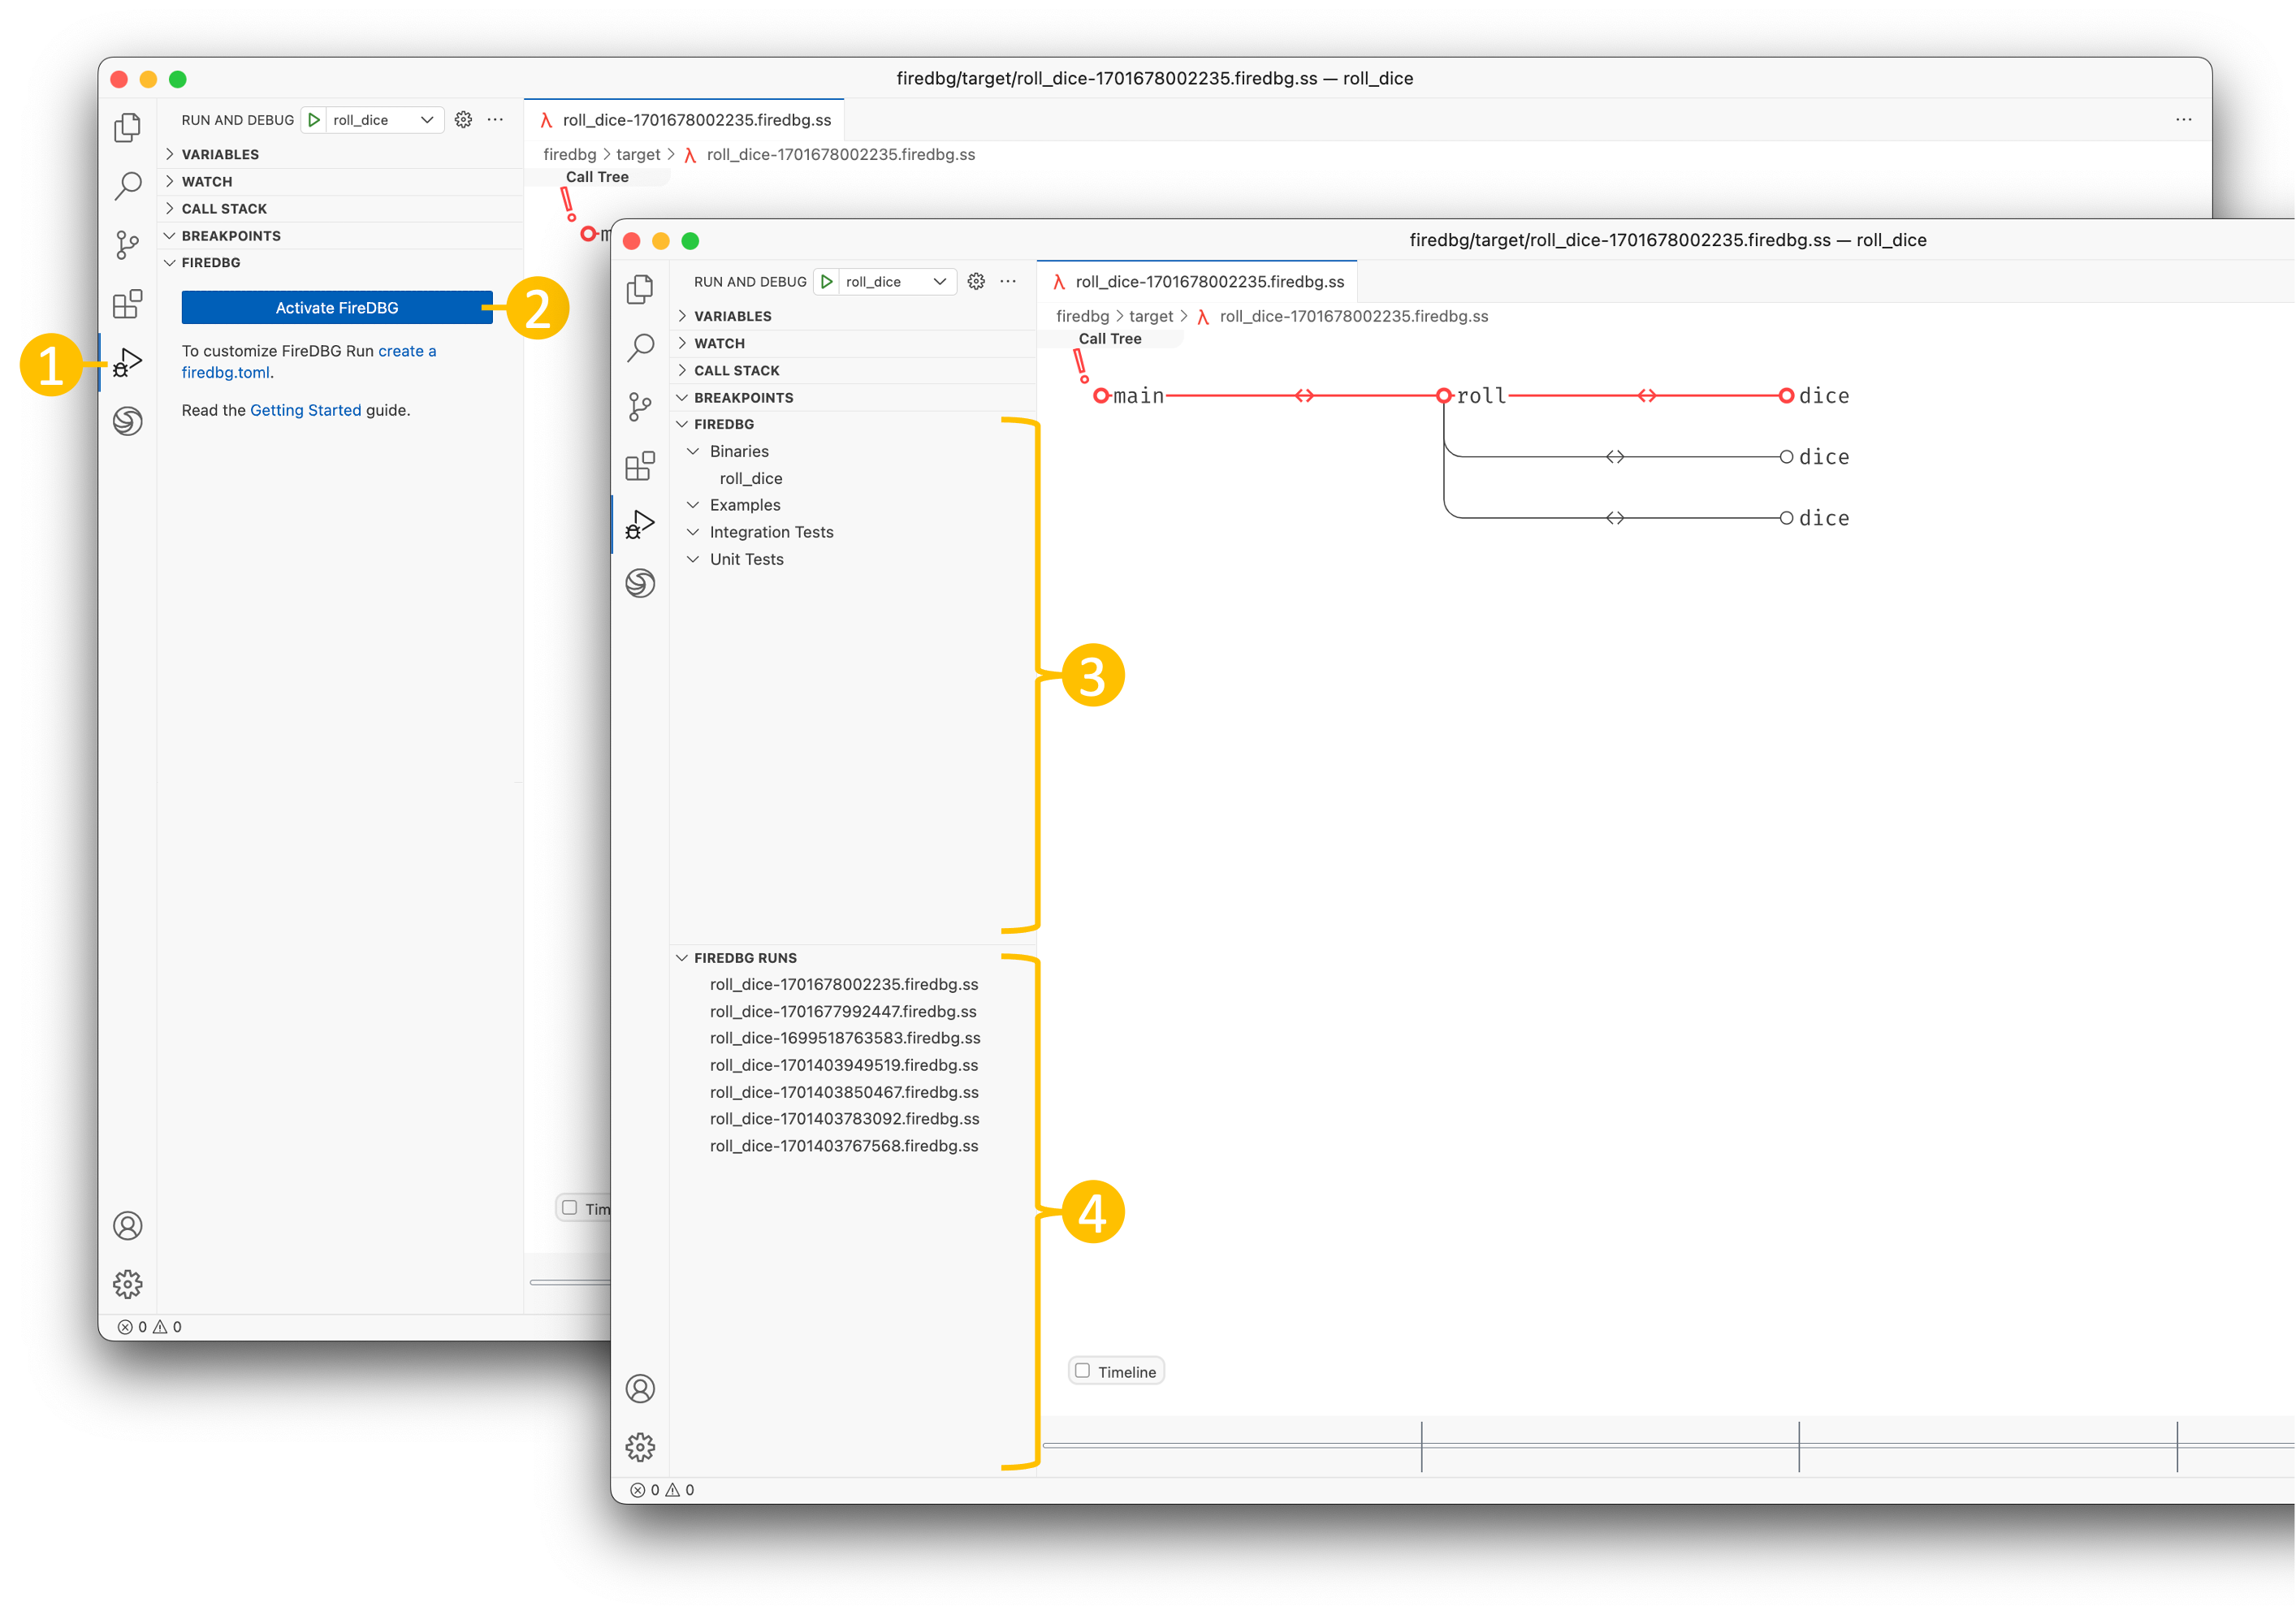
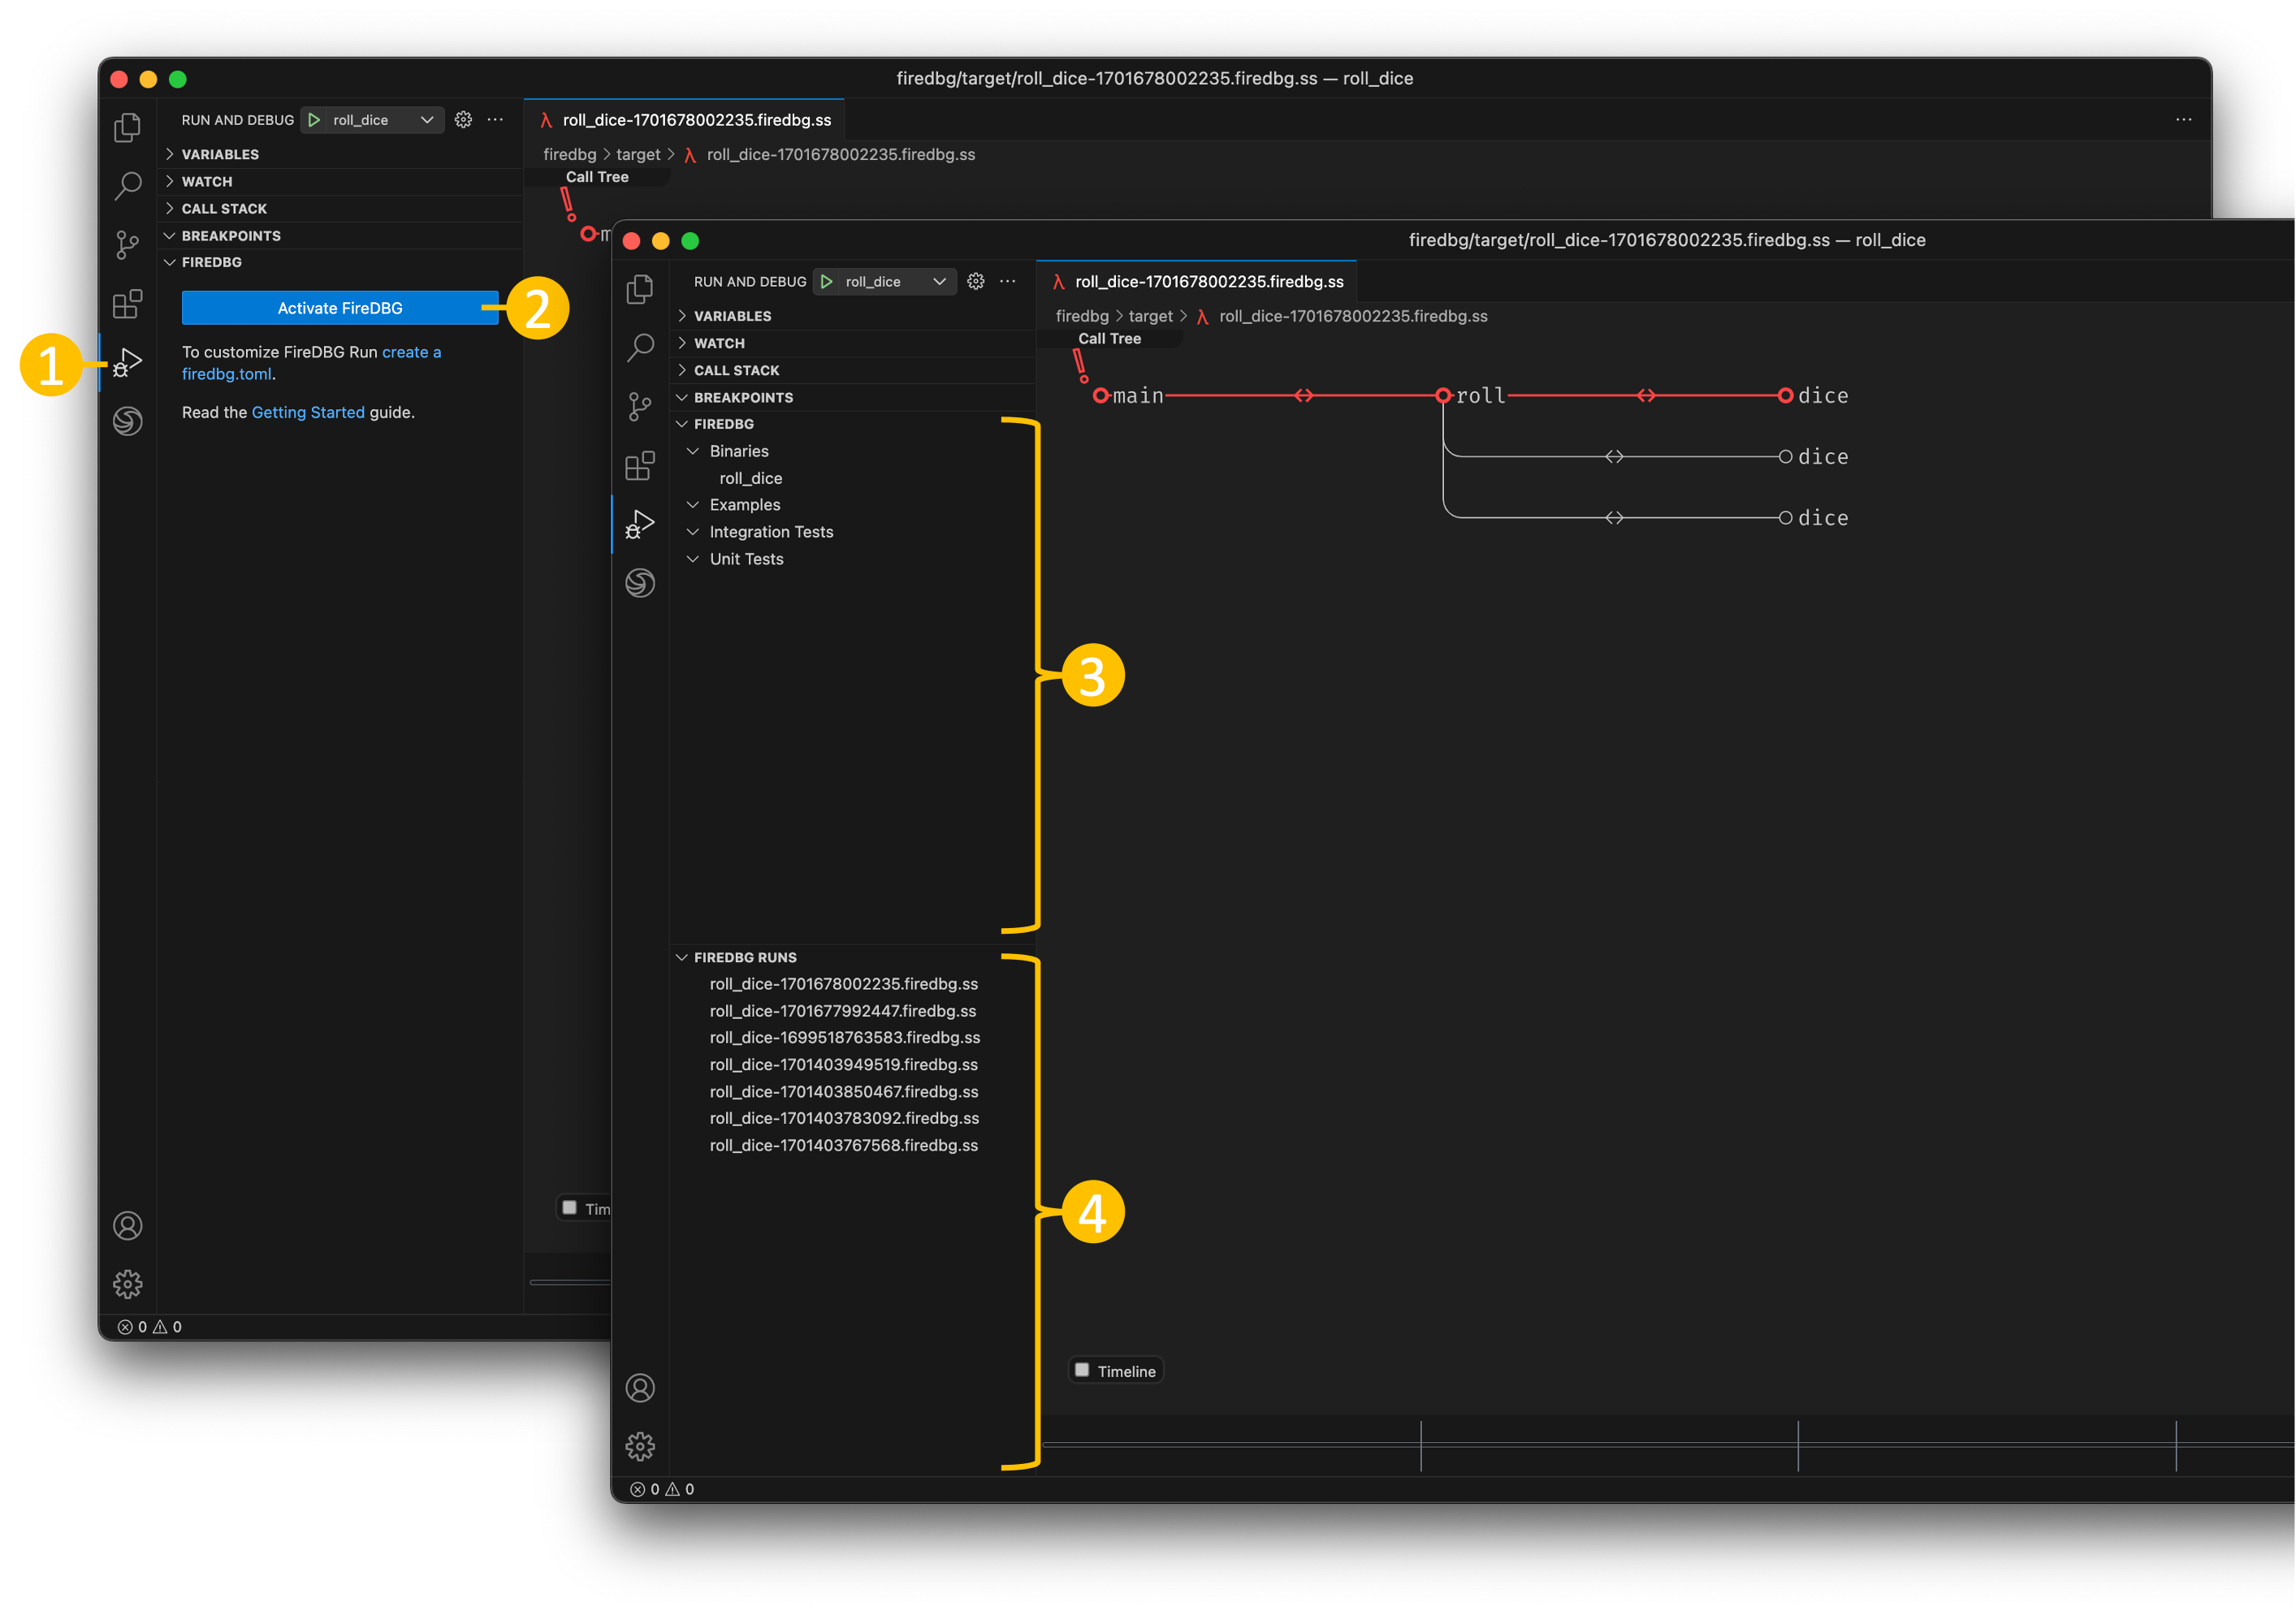
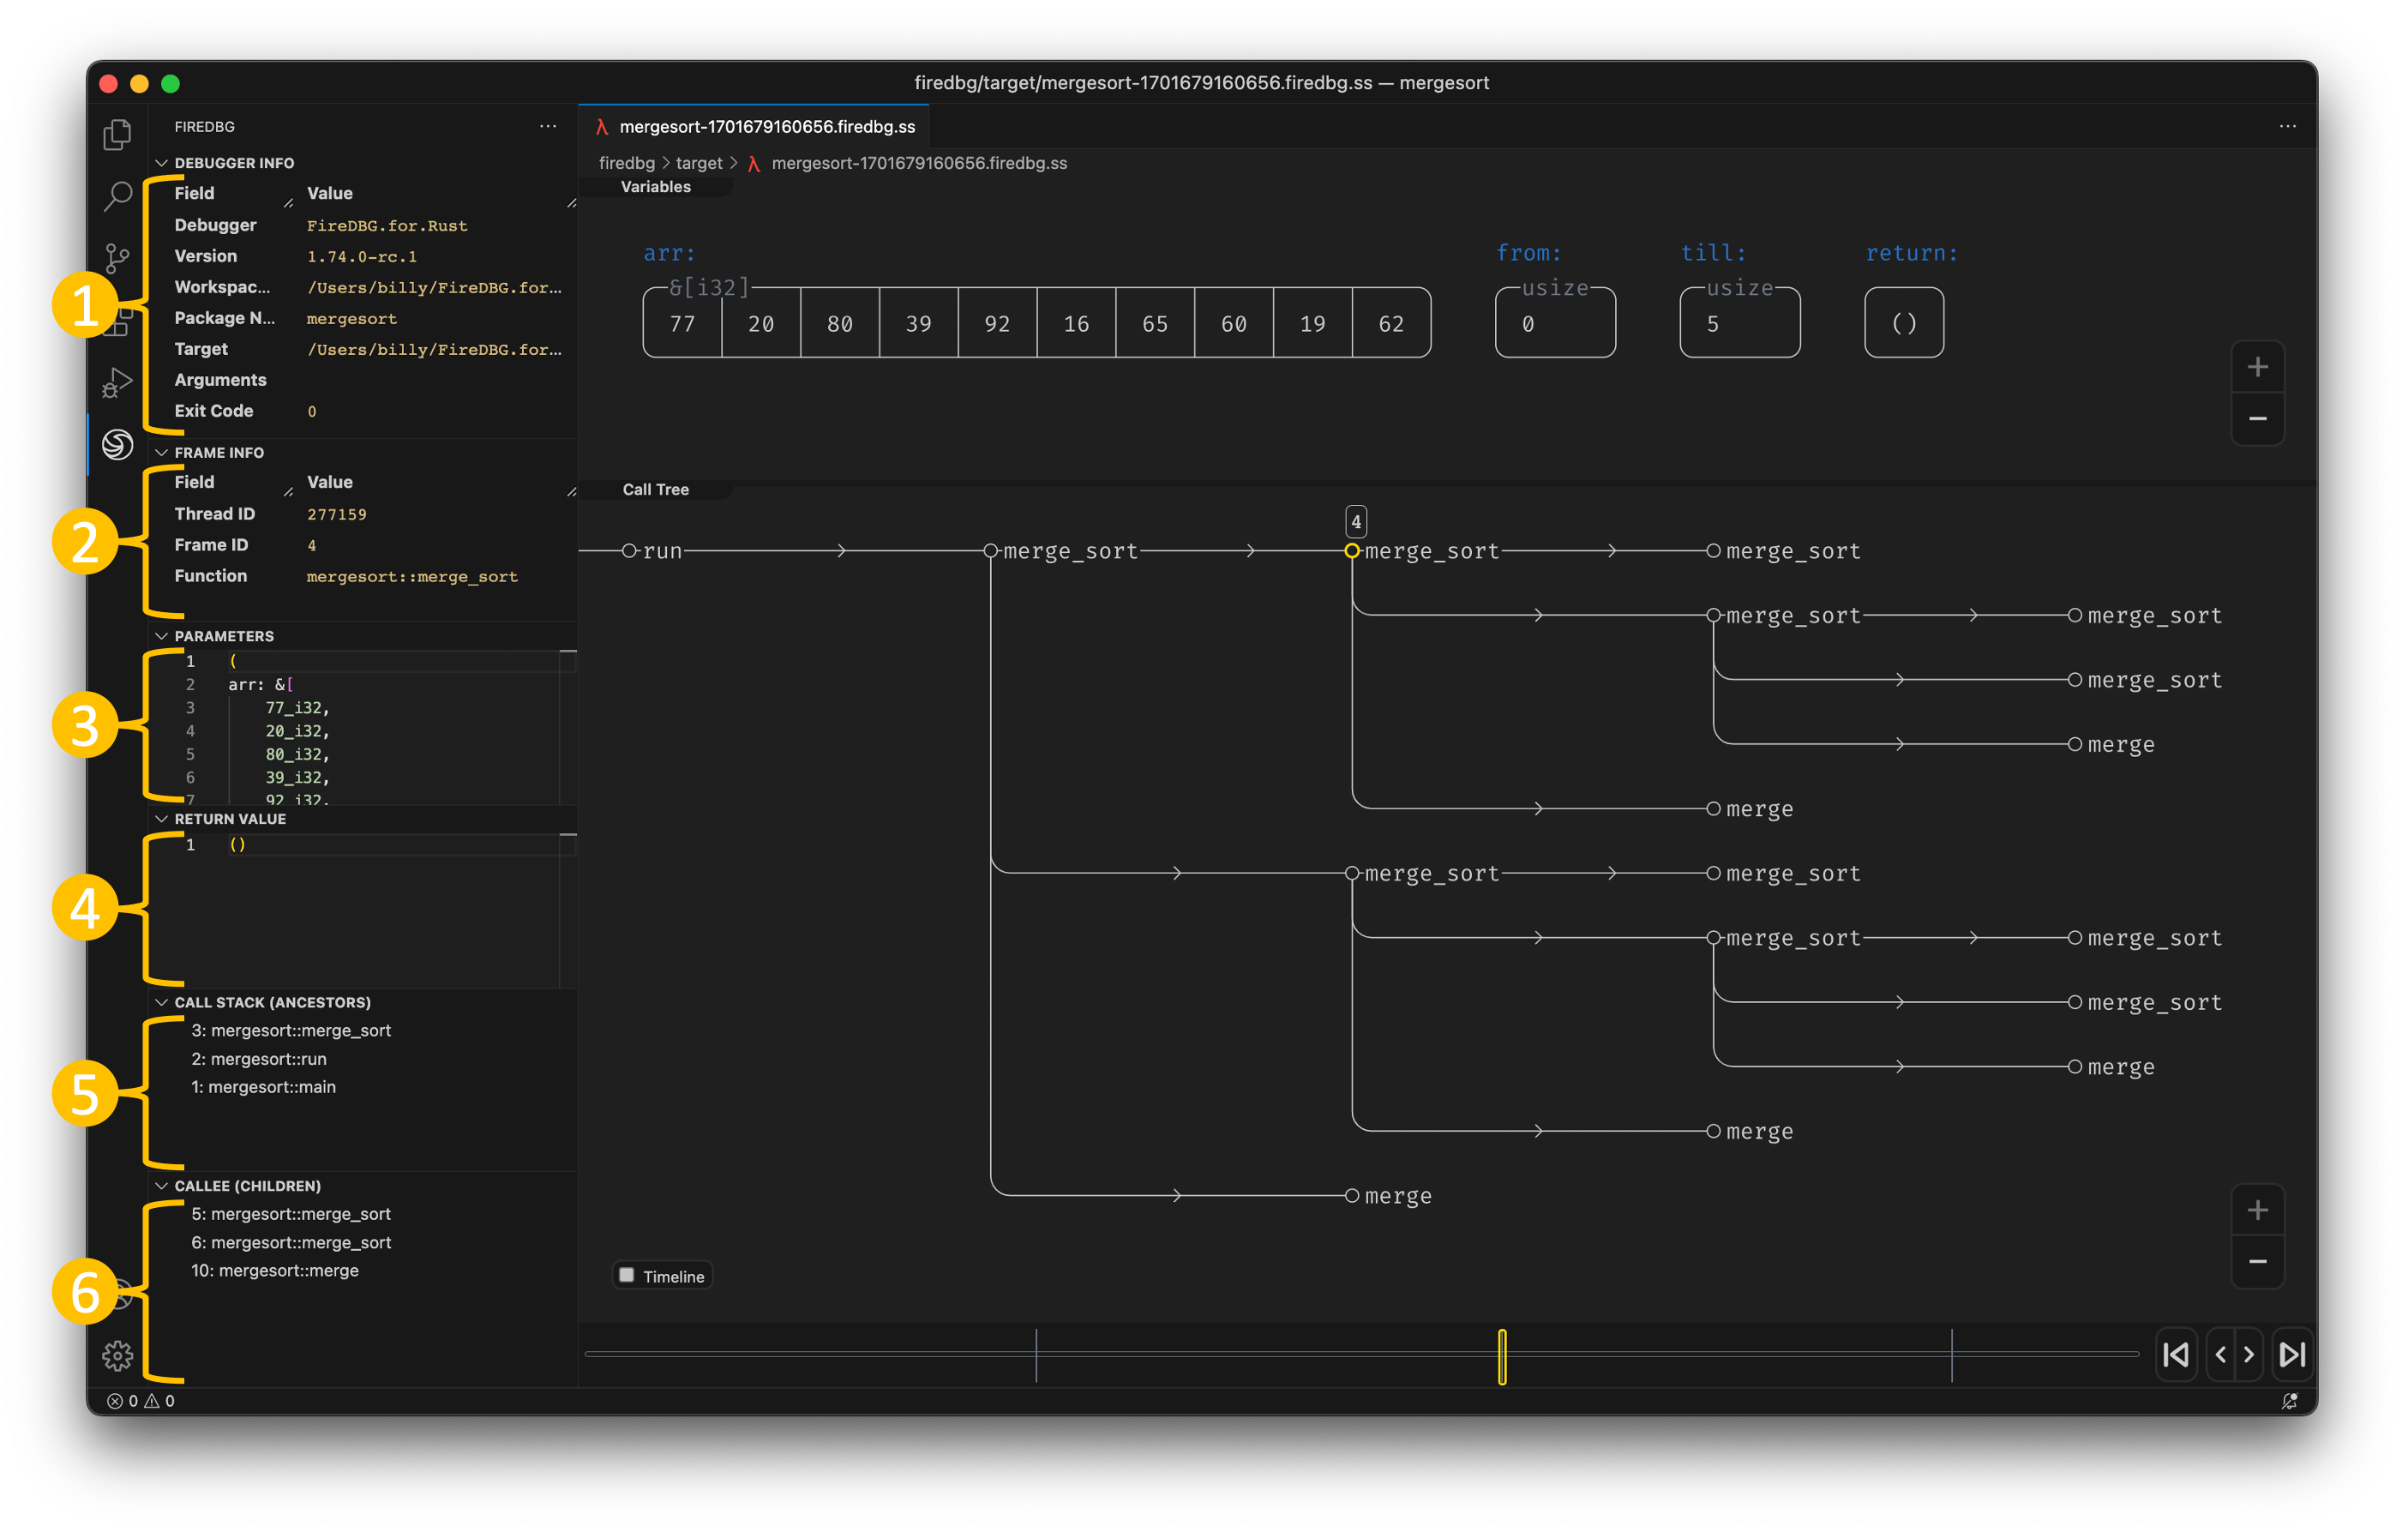
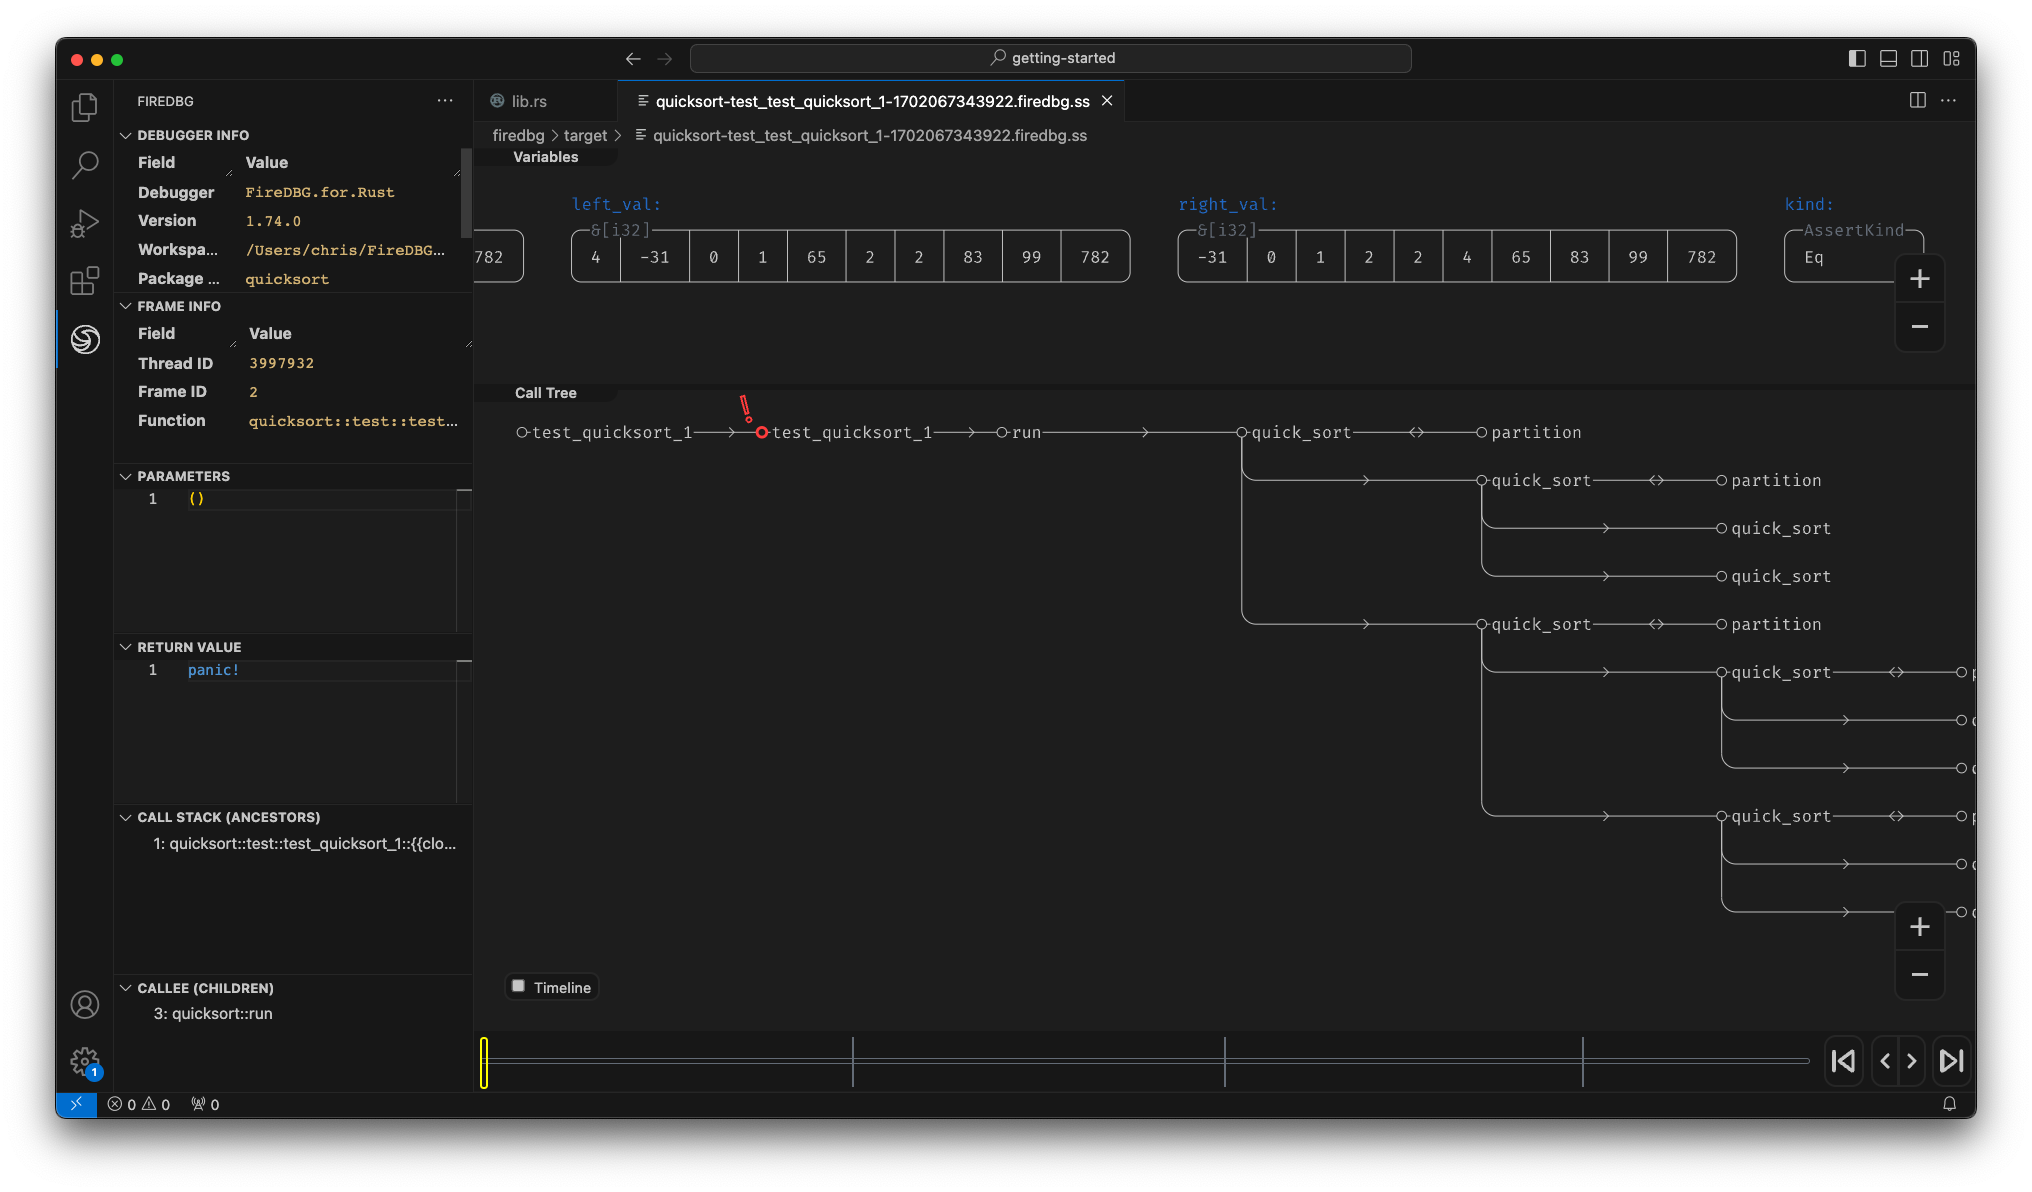
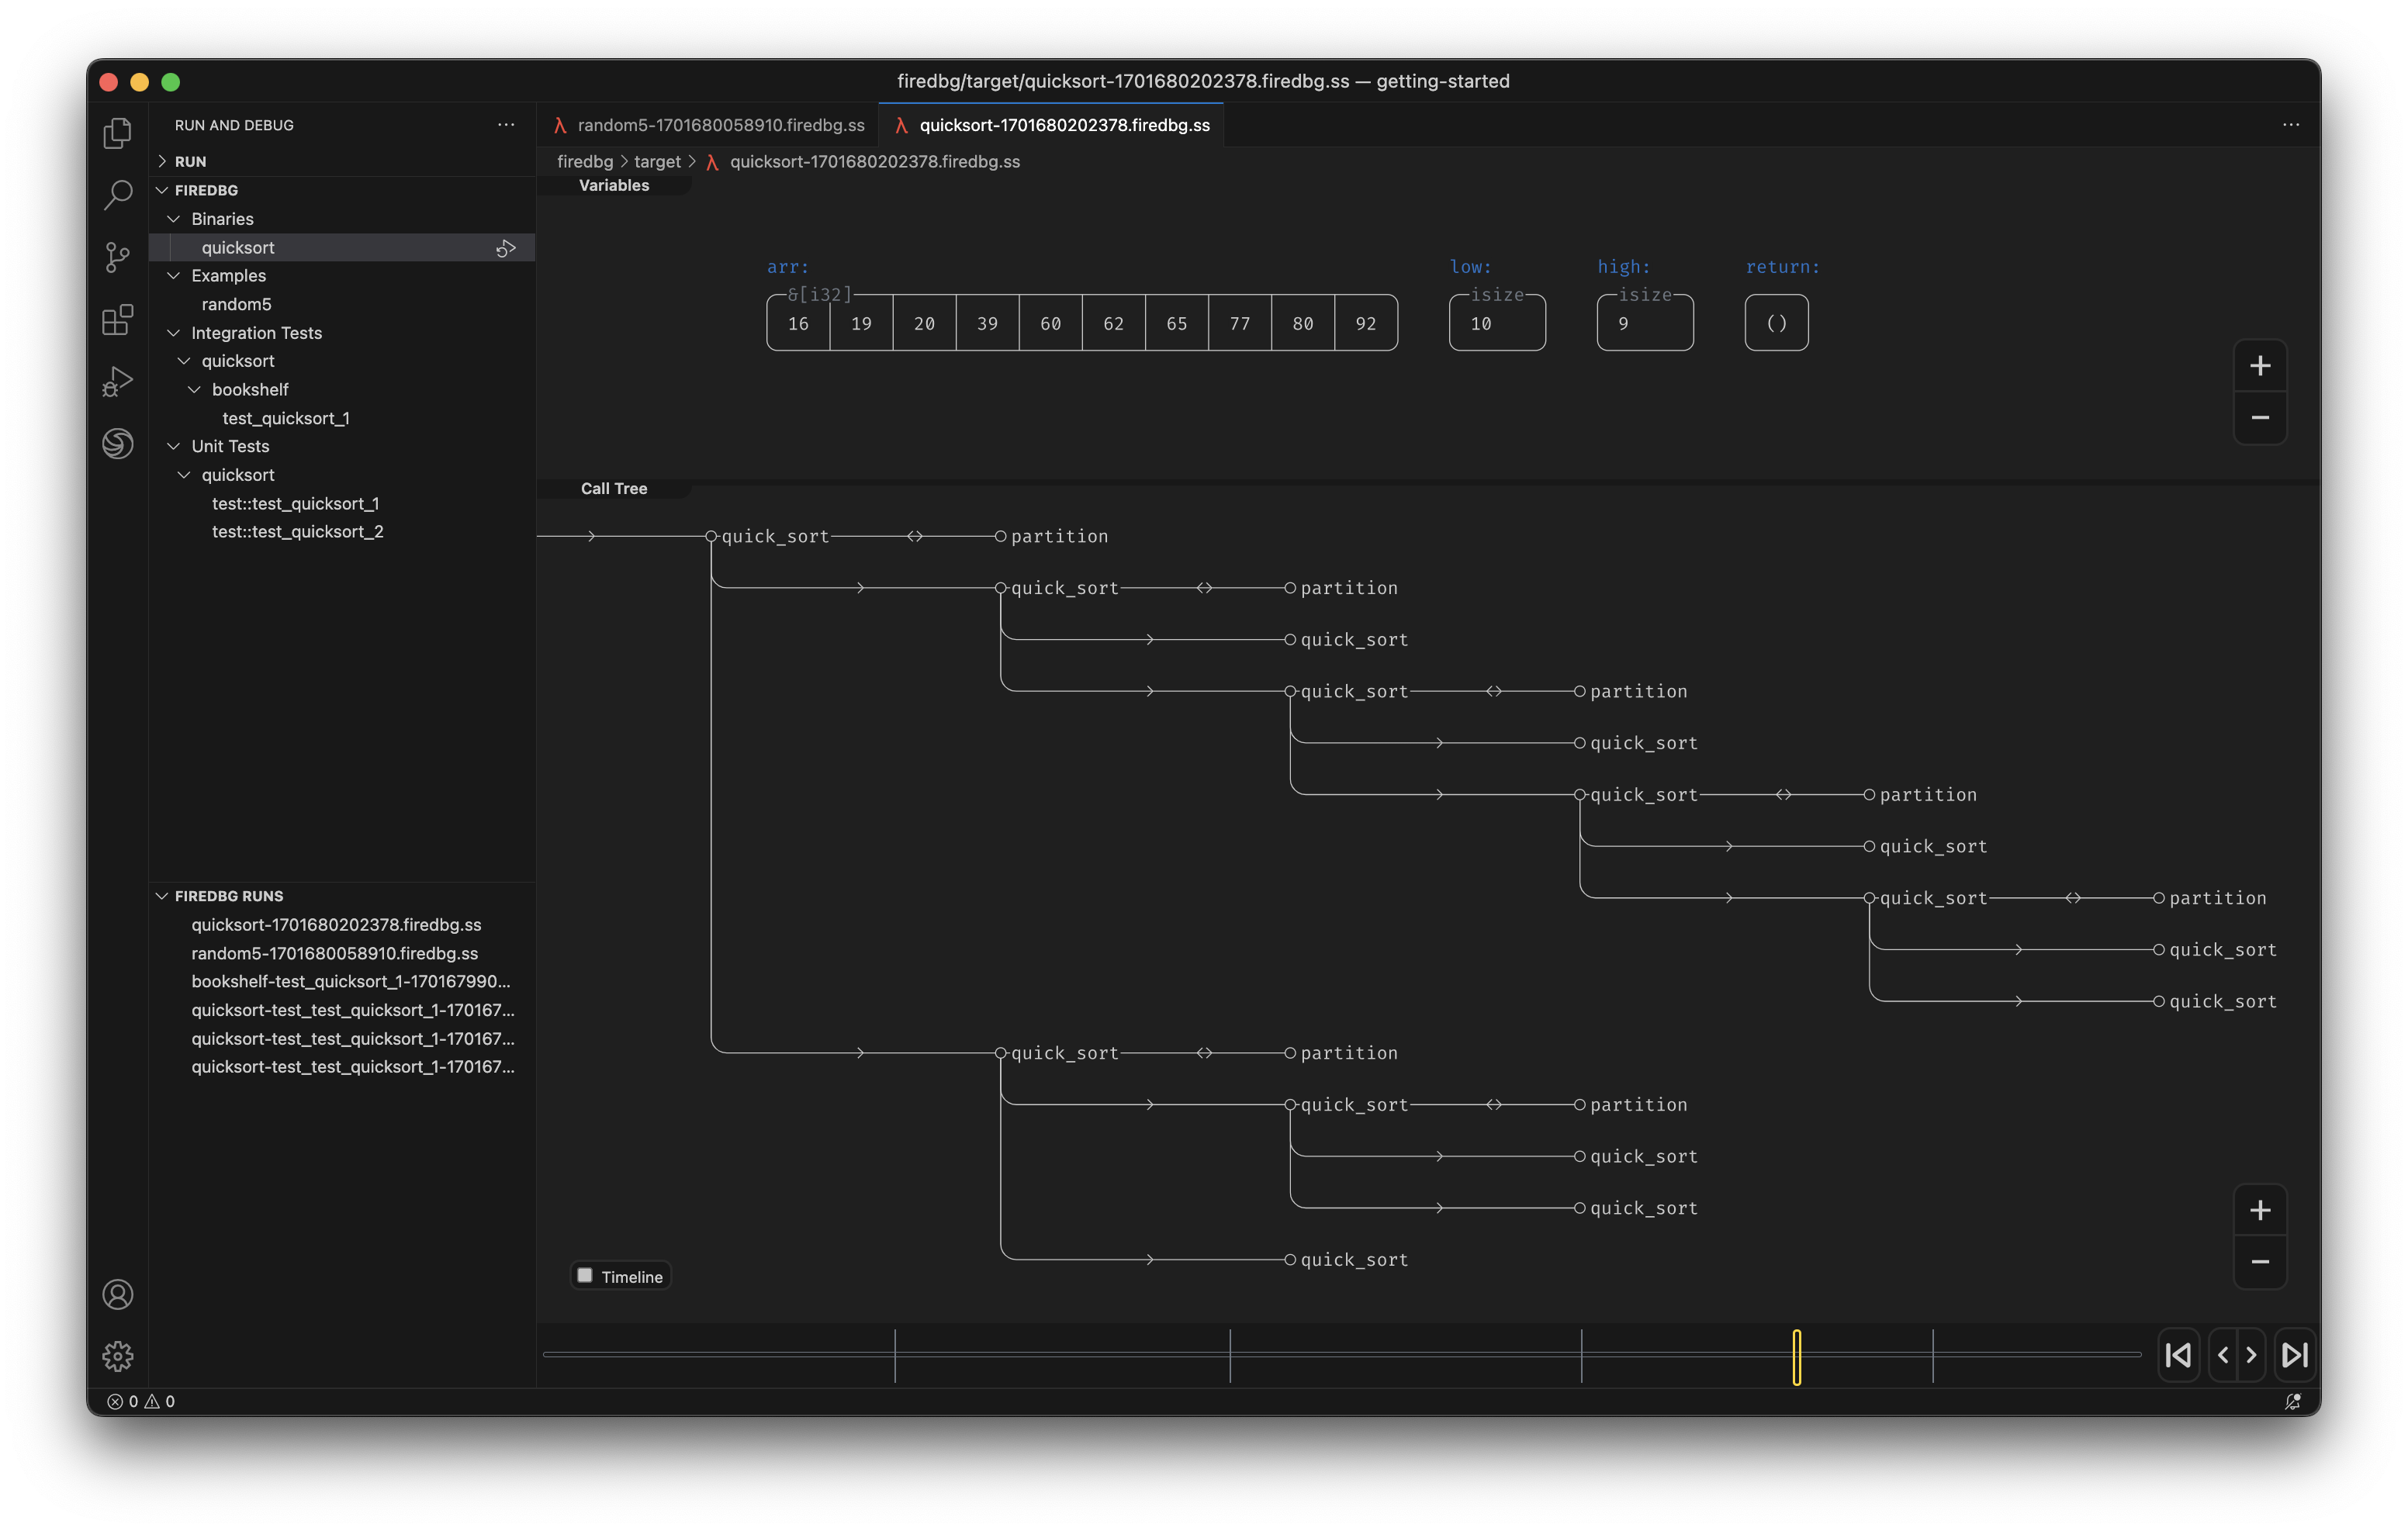
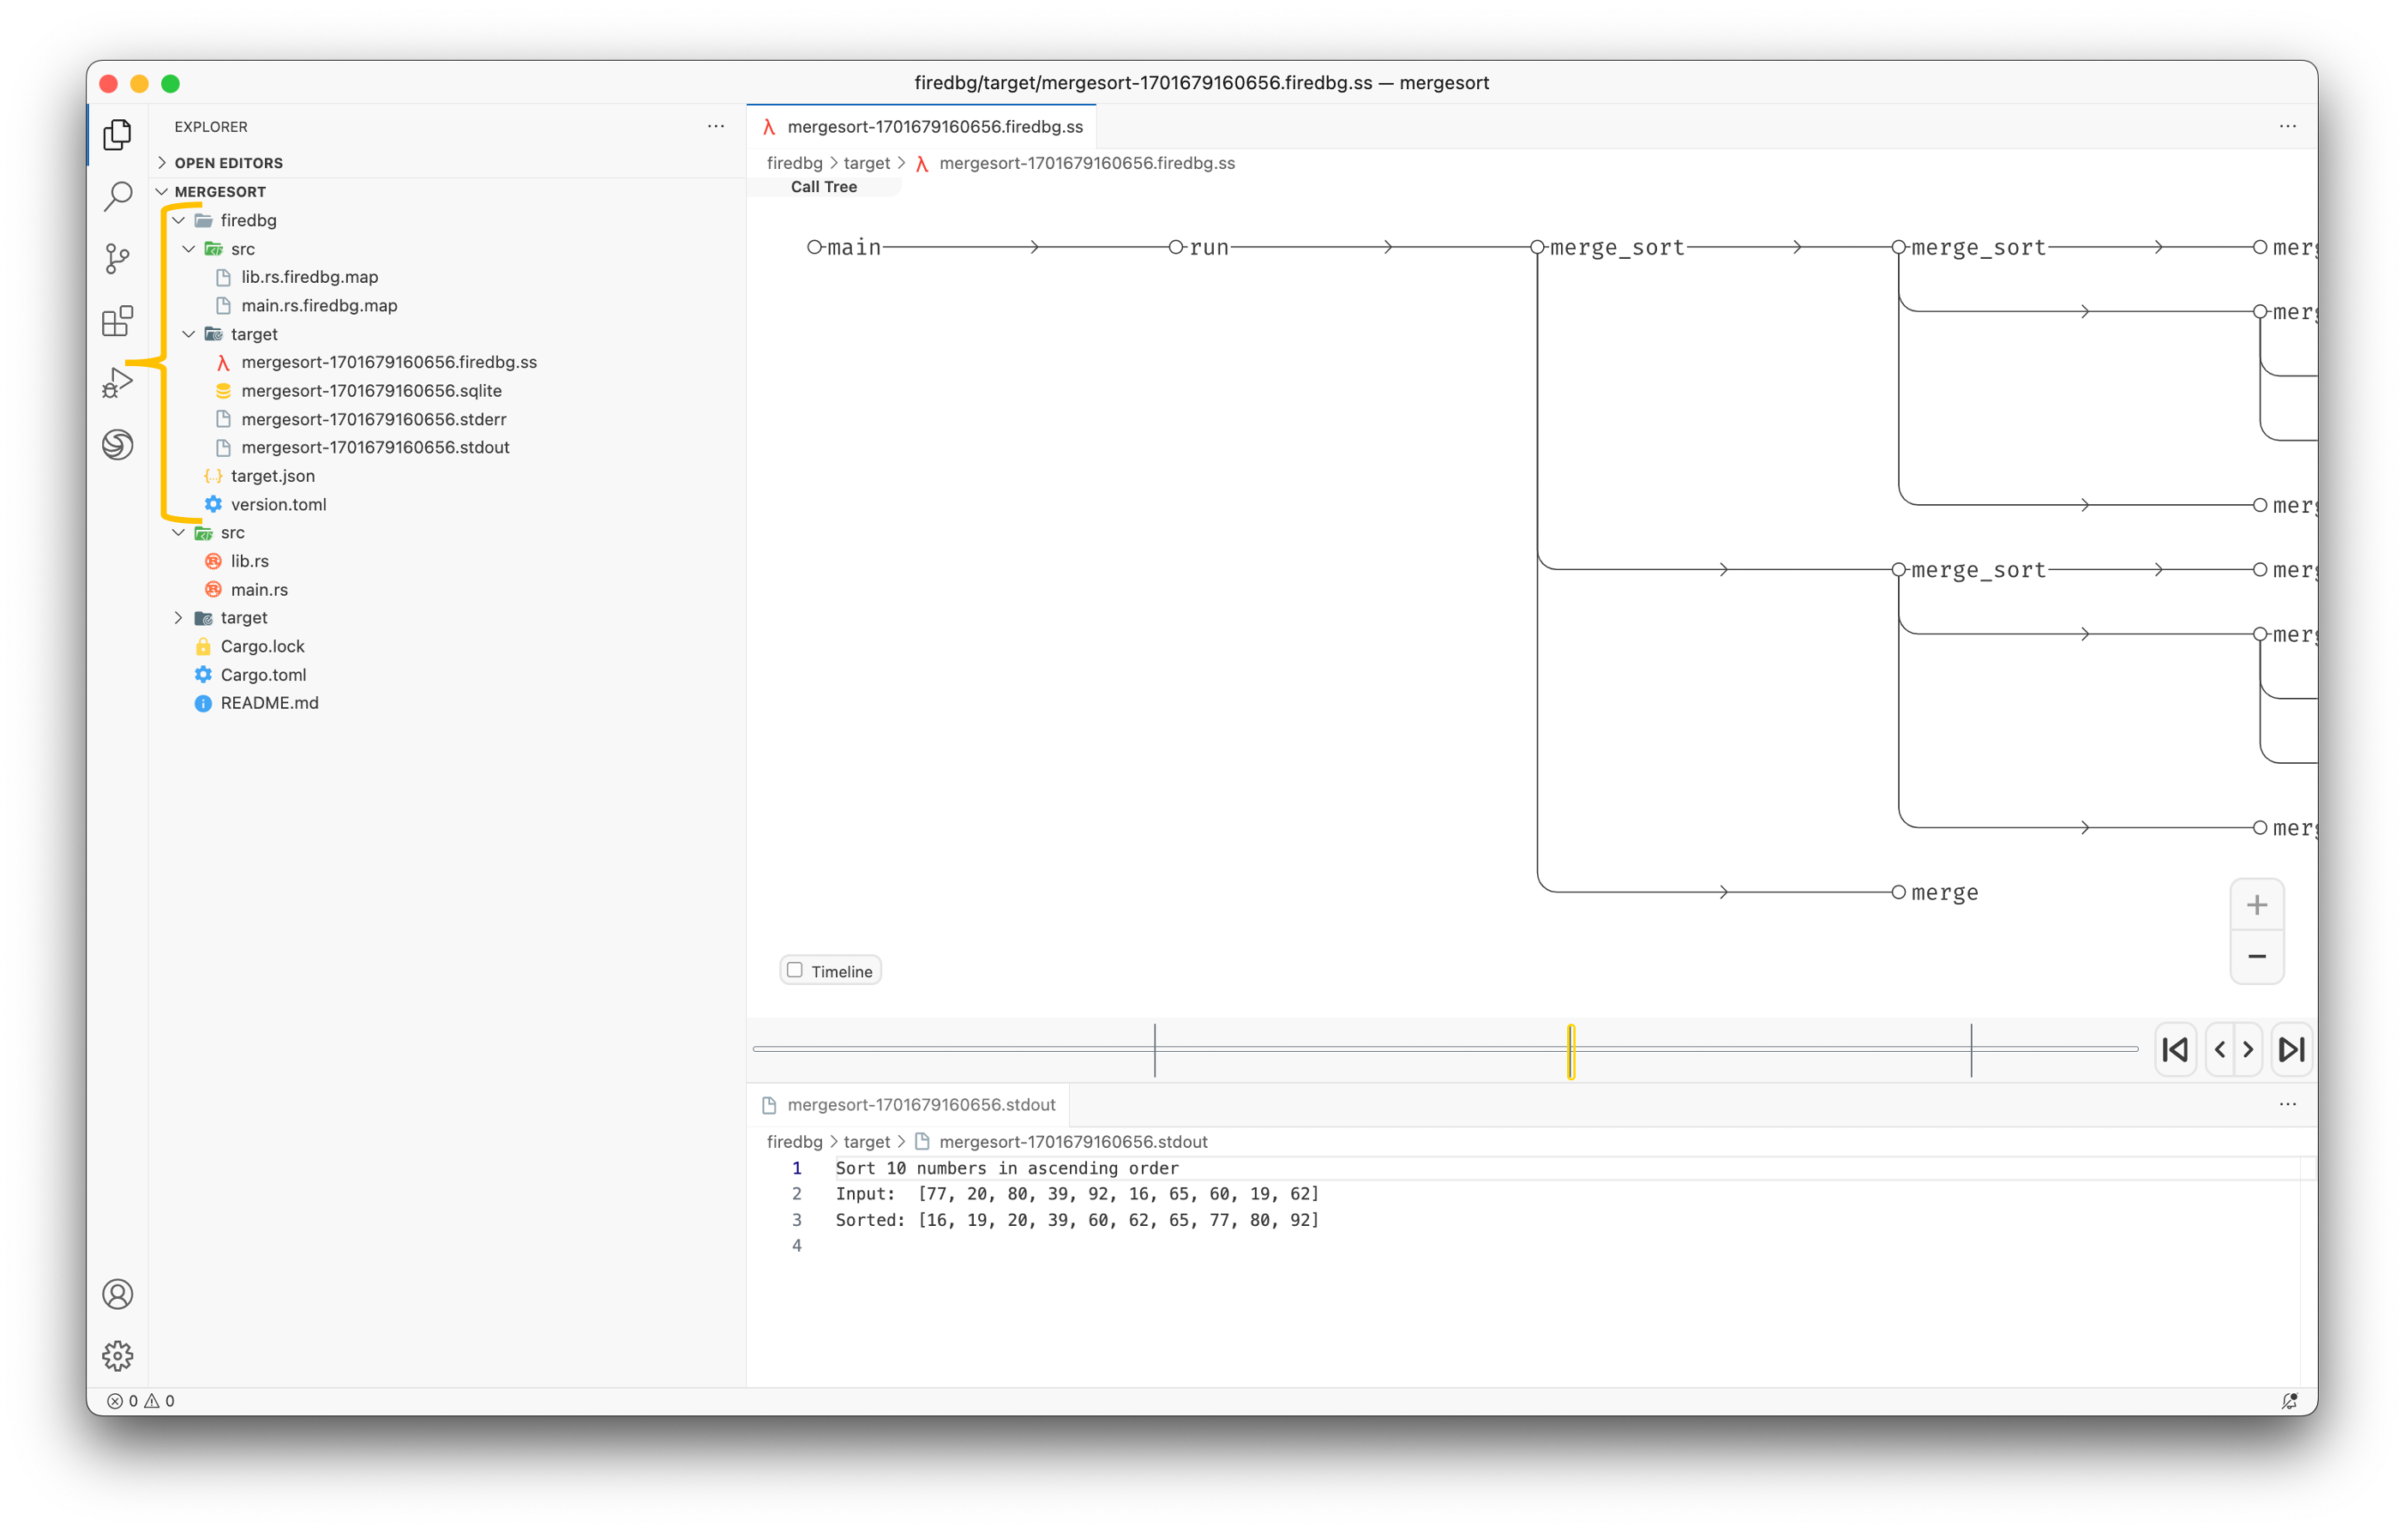
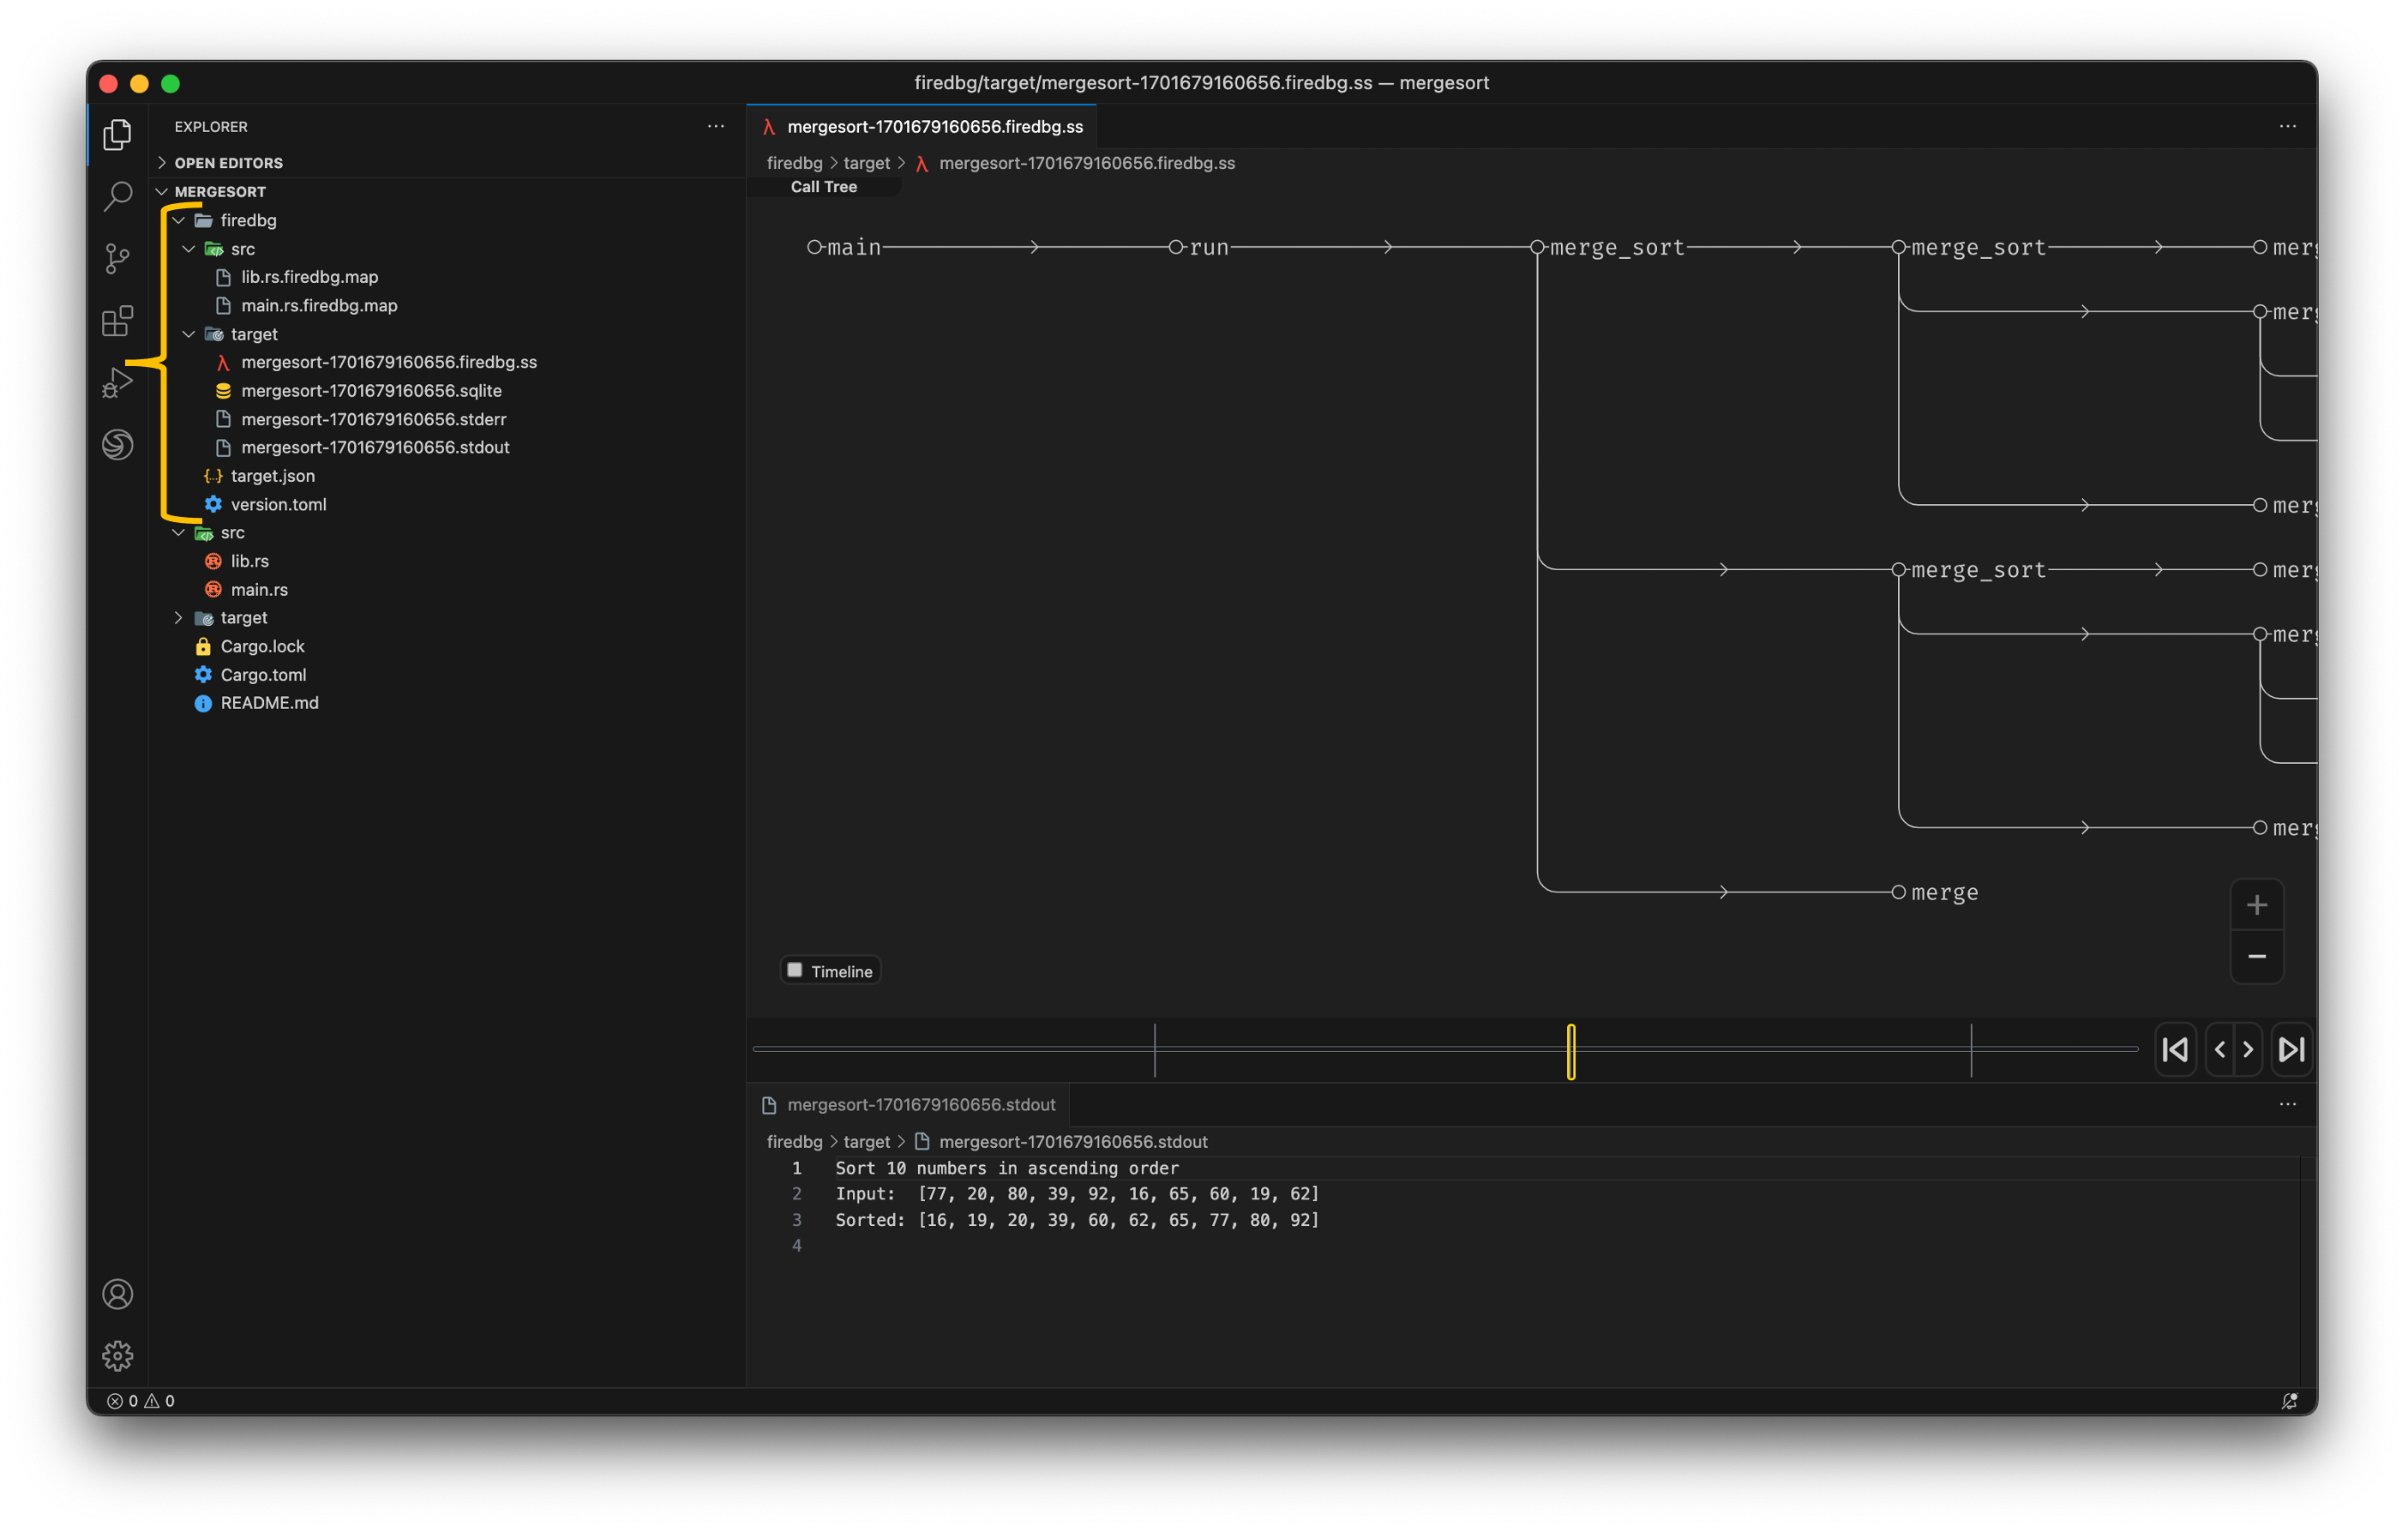
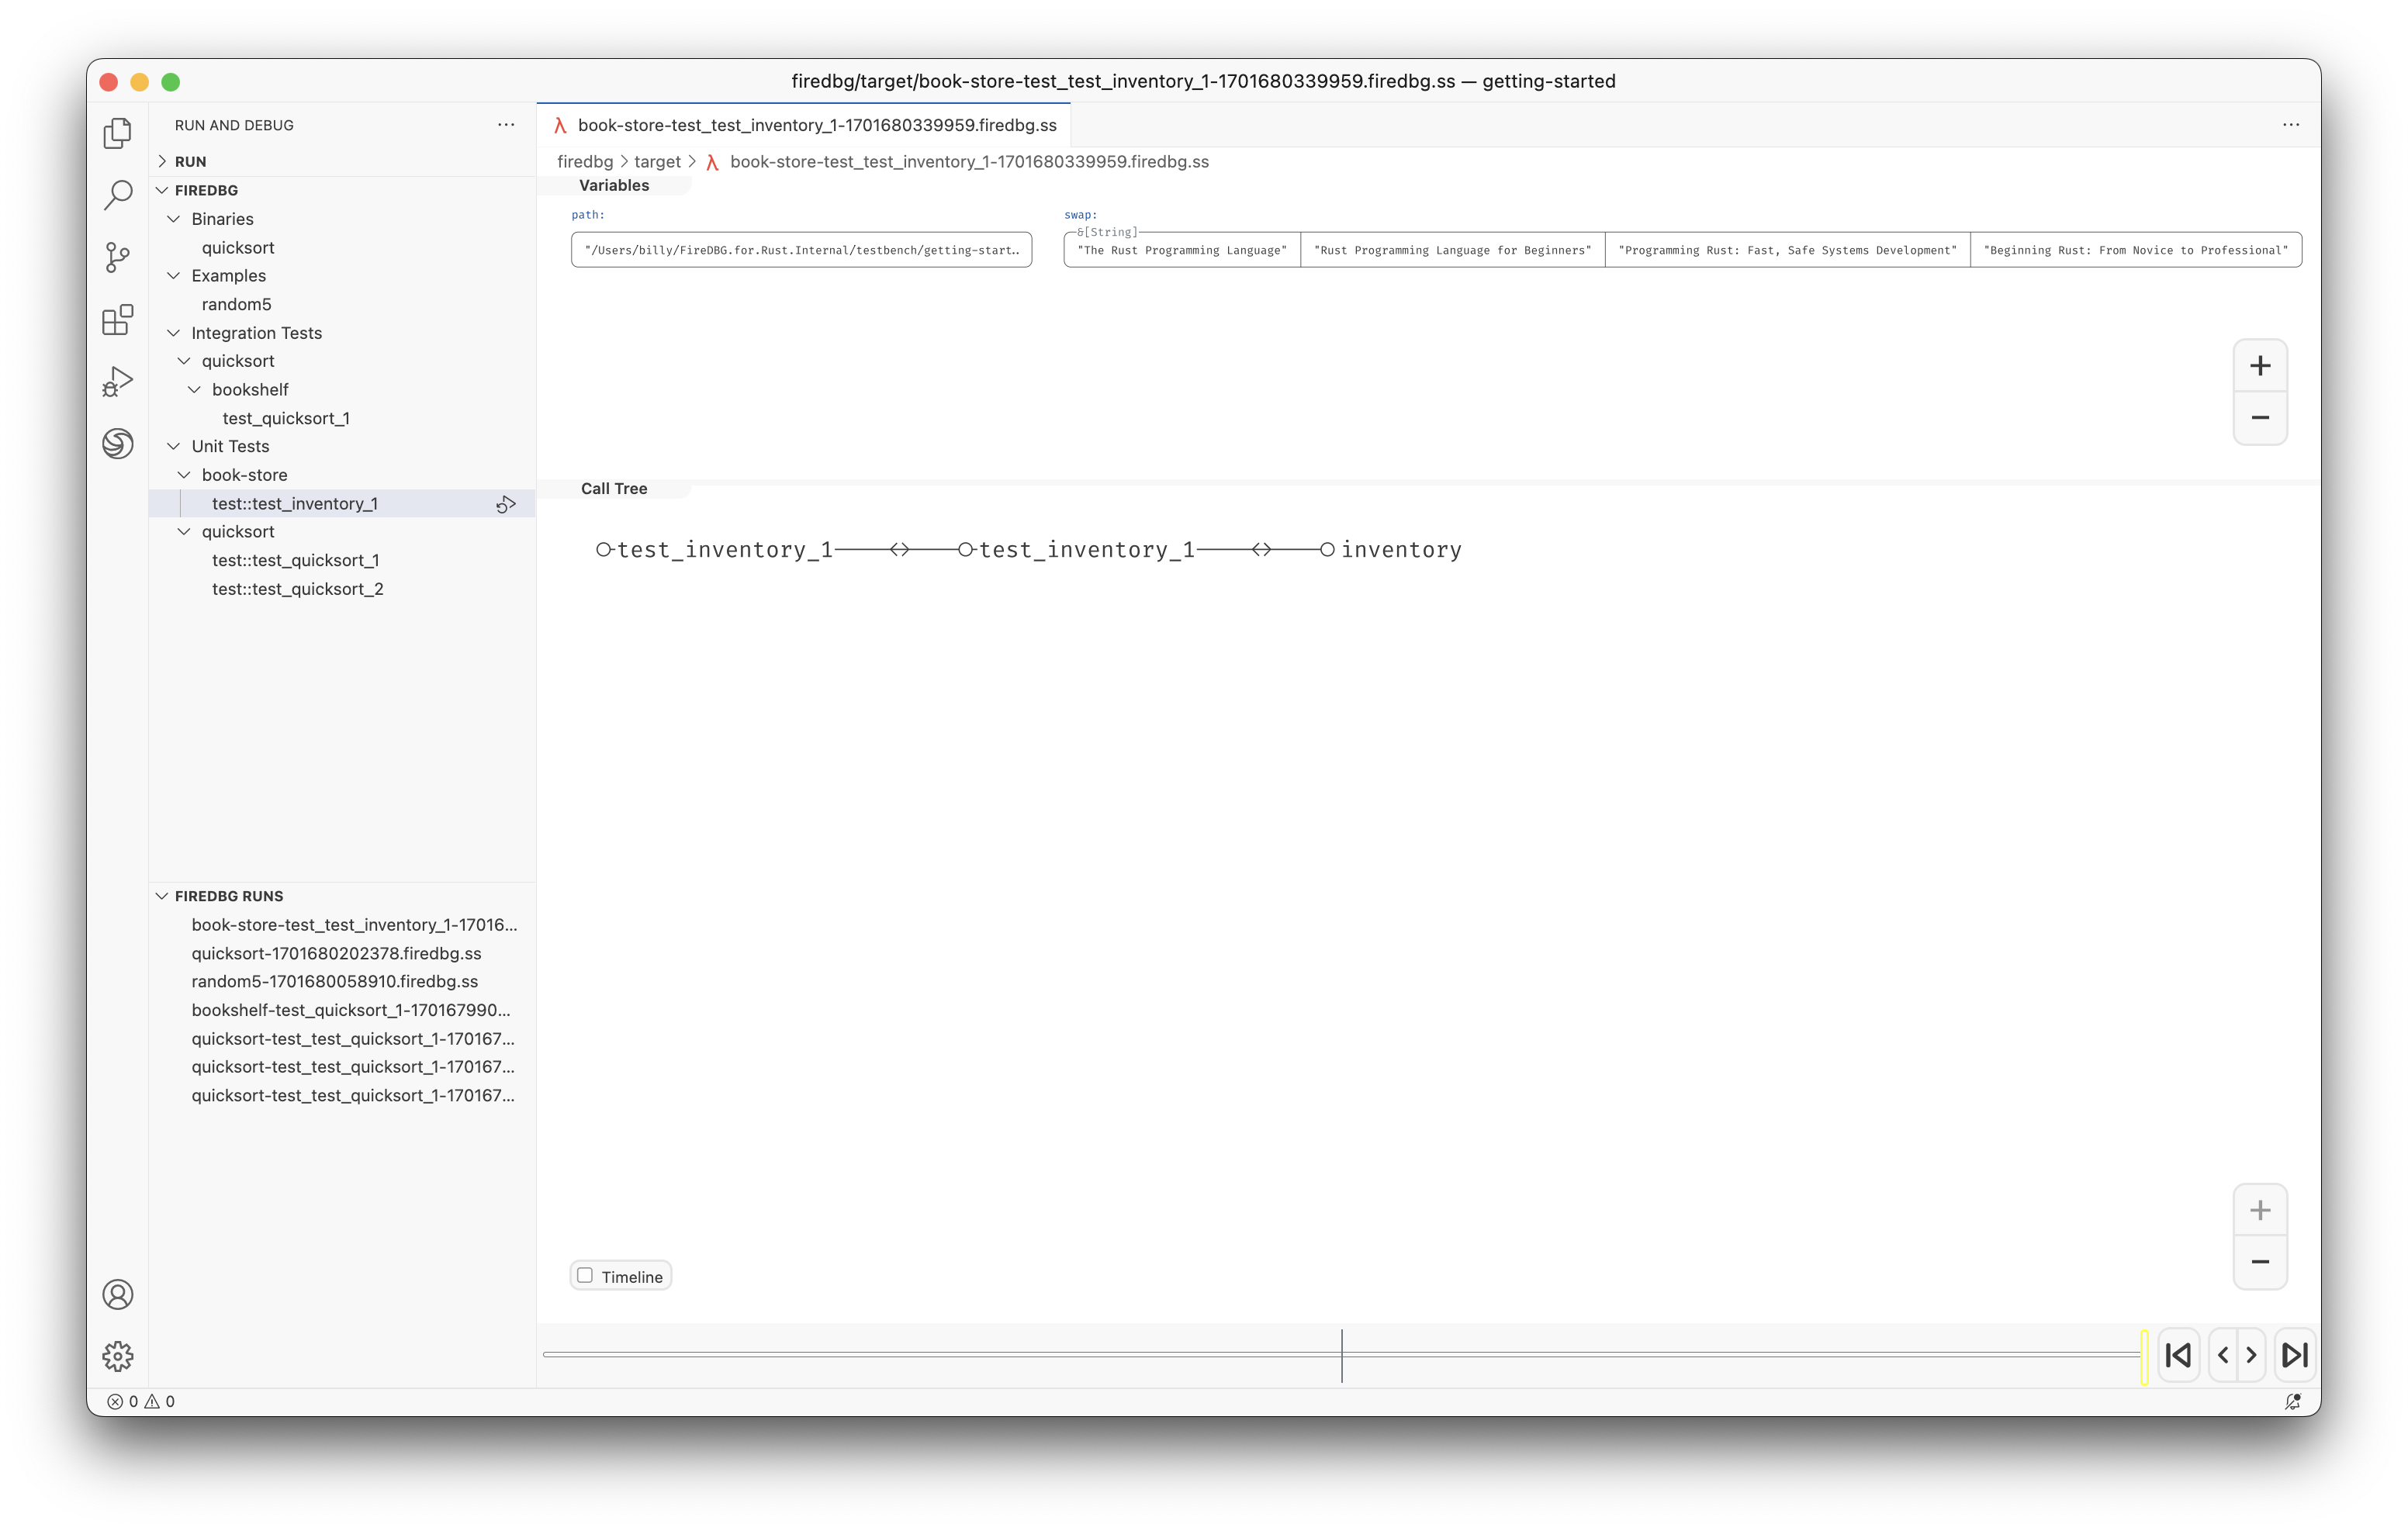
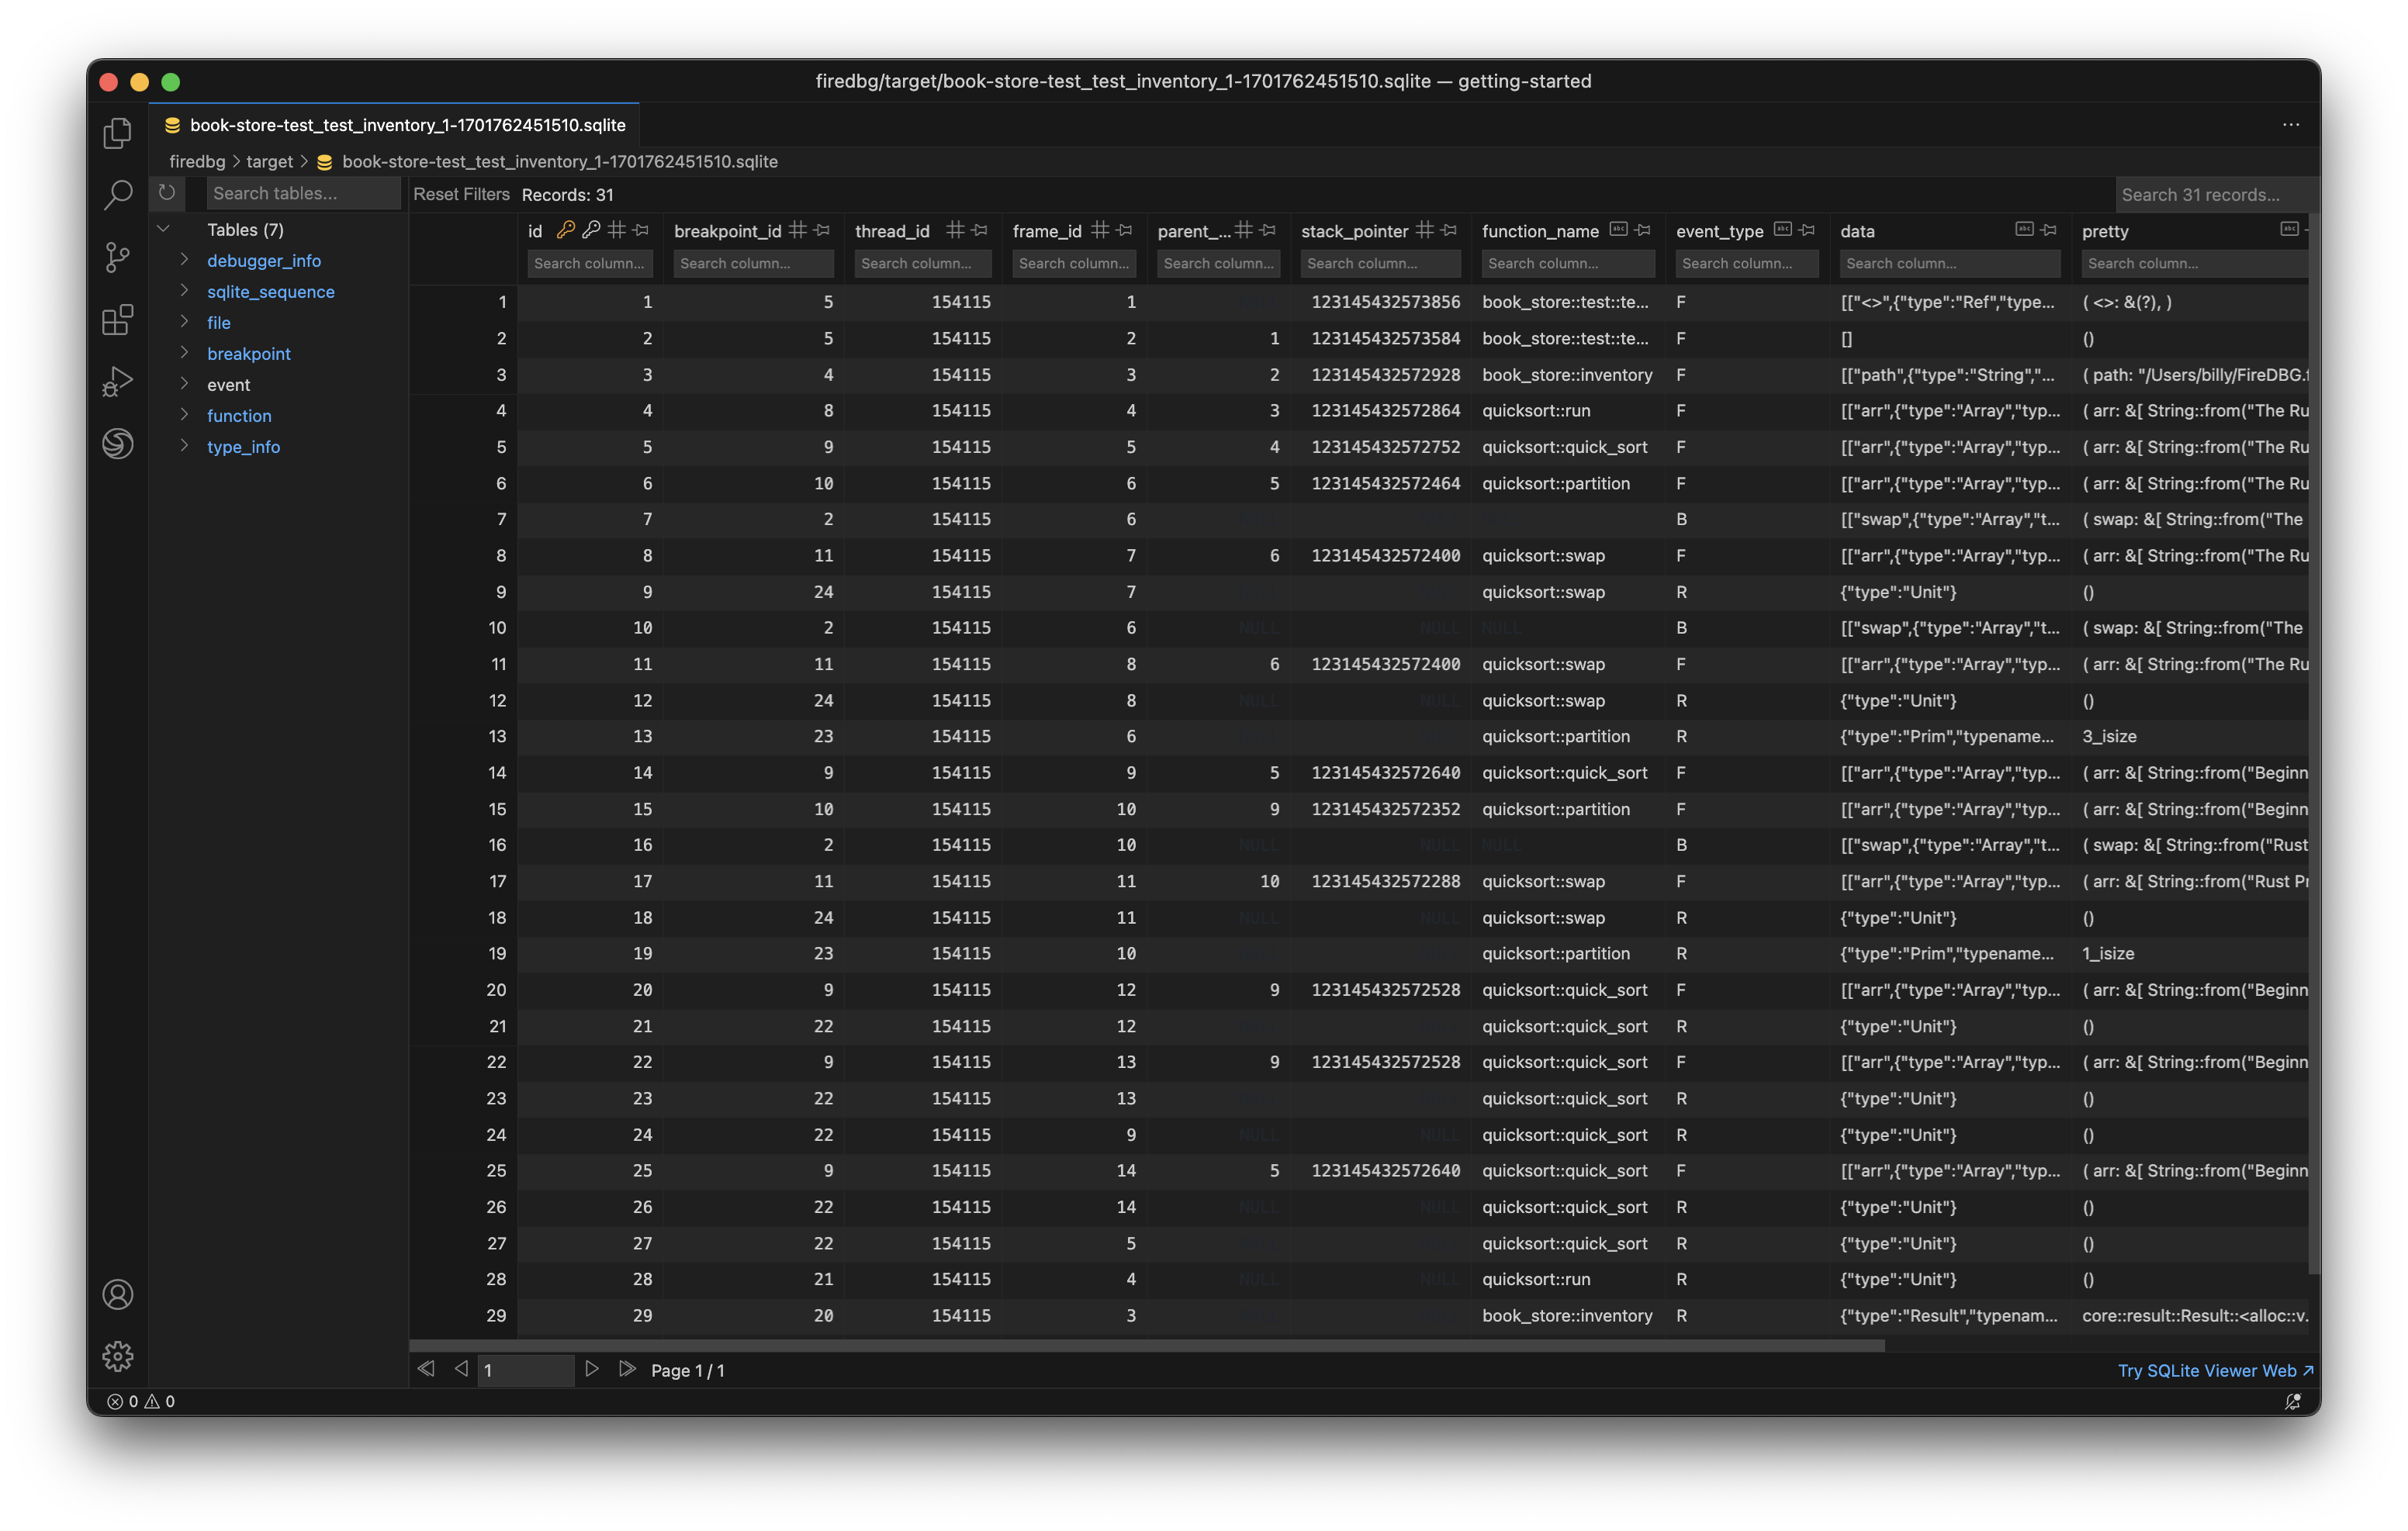
FireDBG
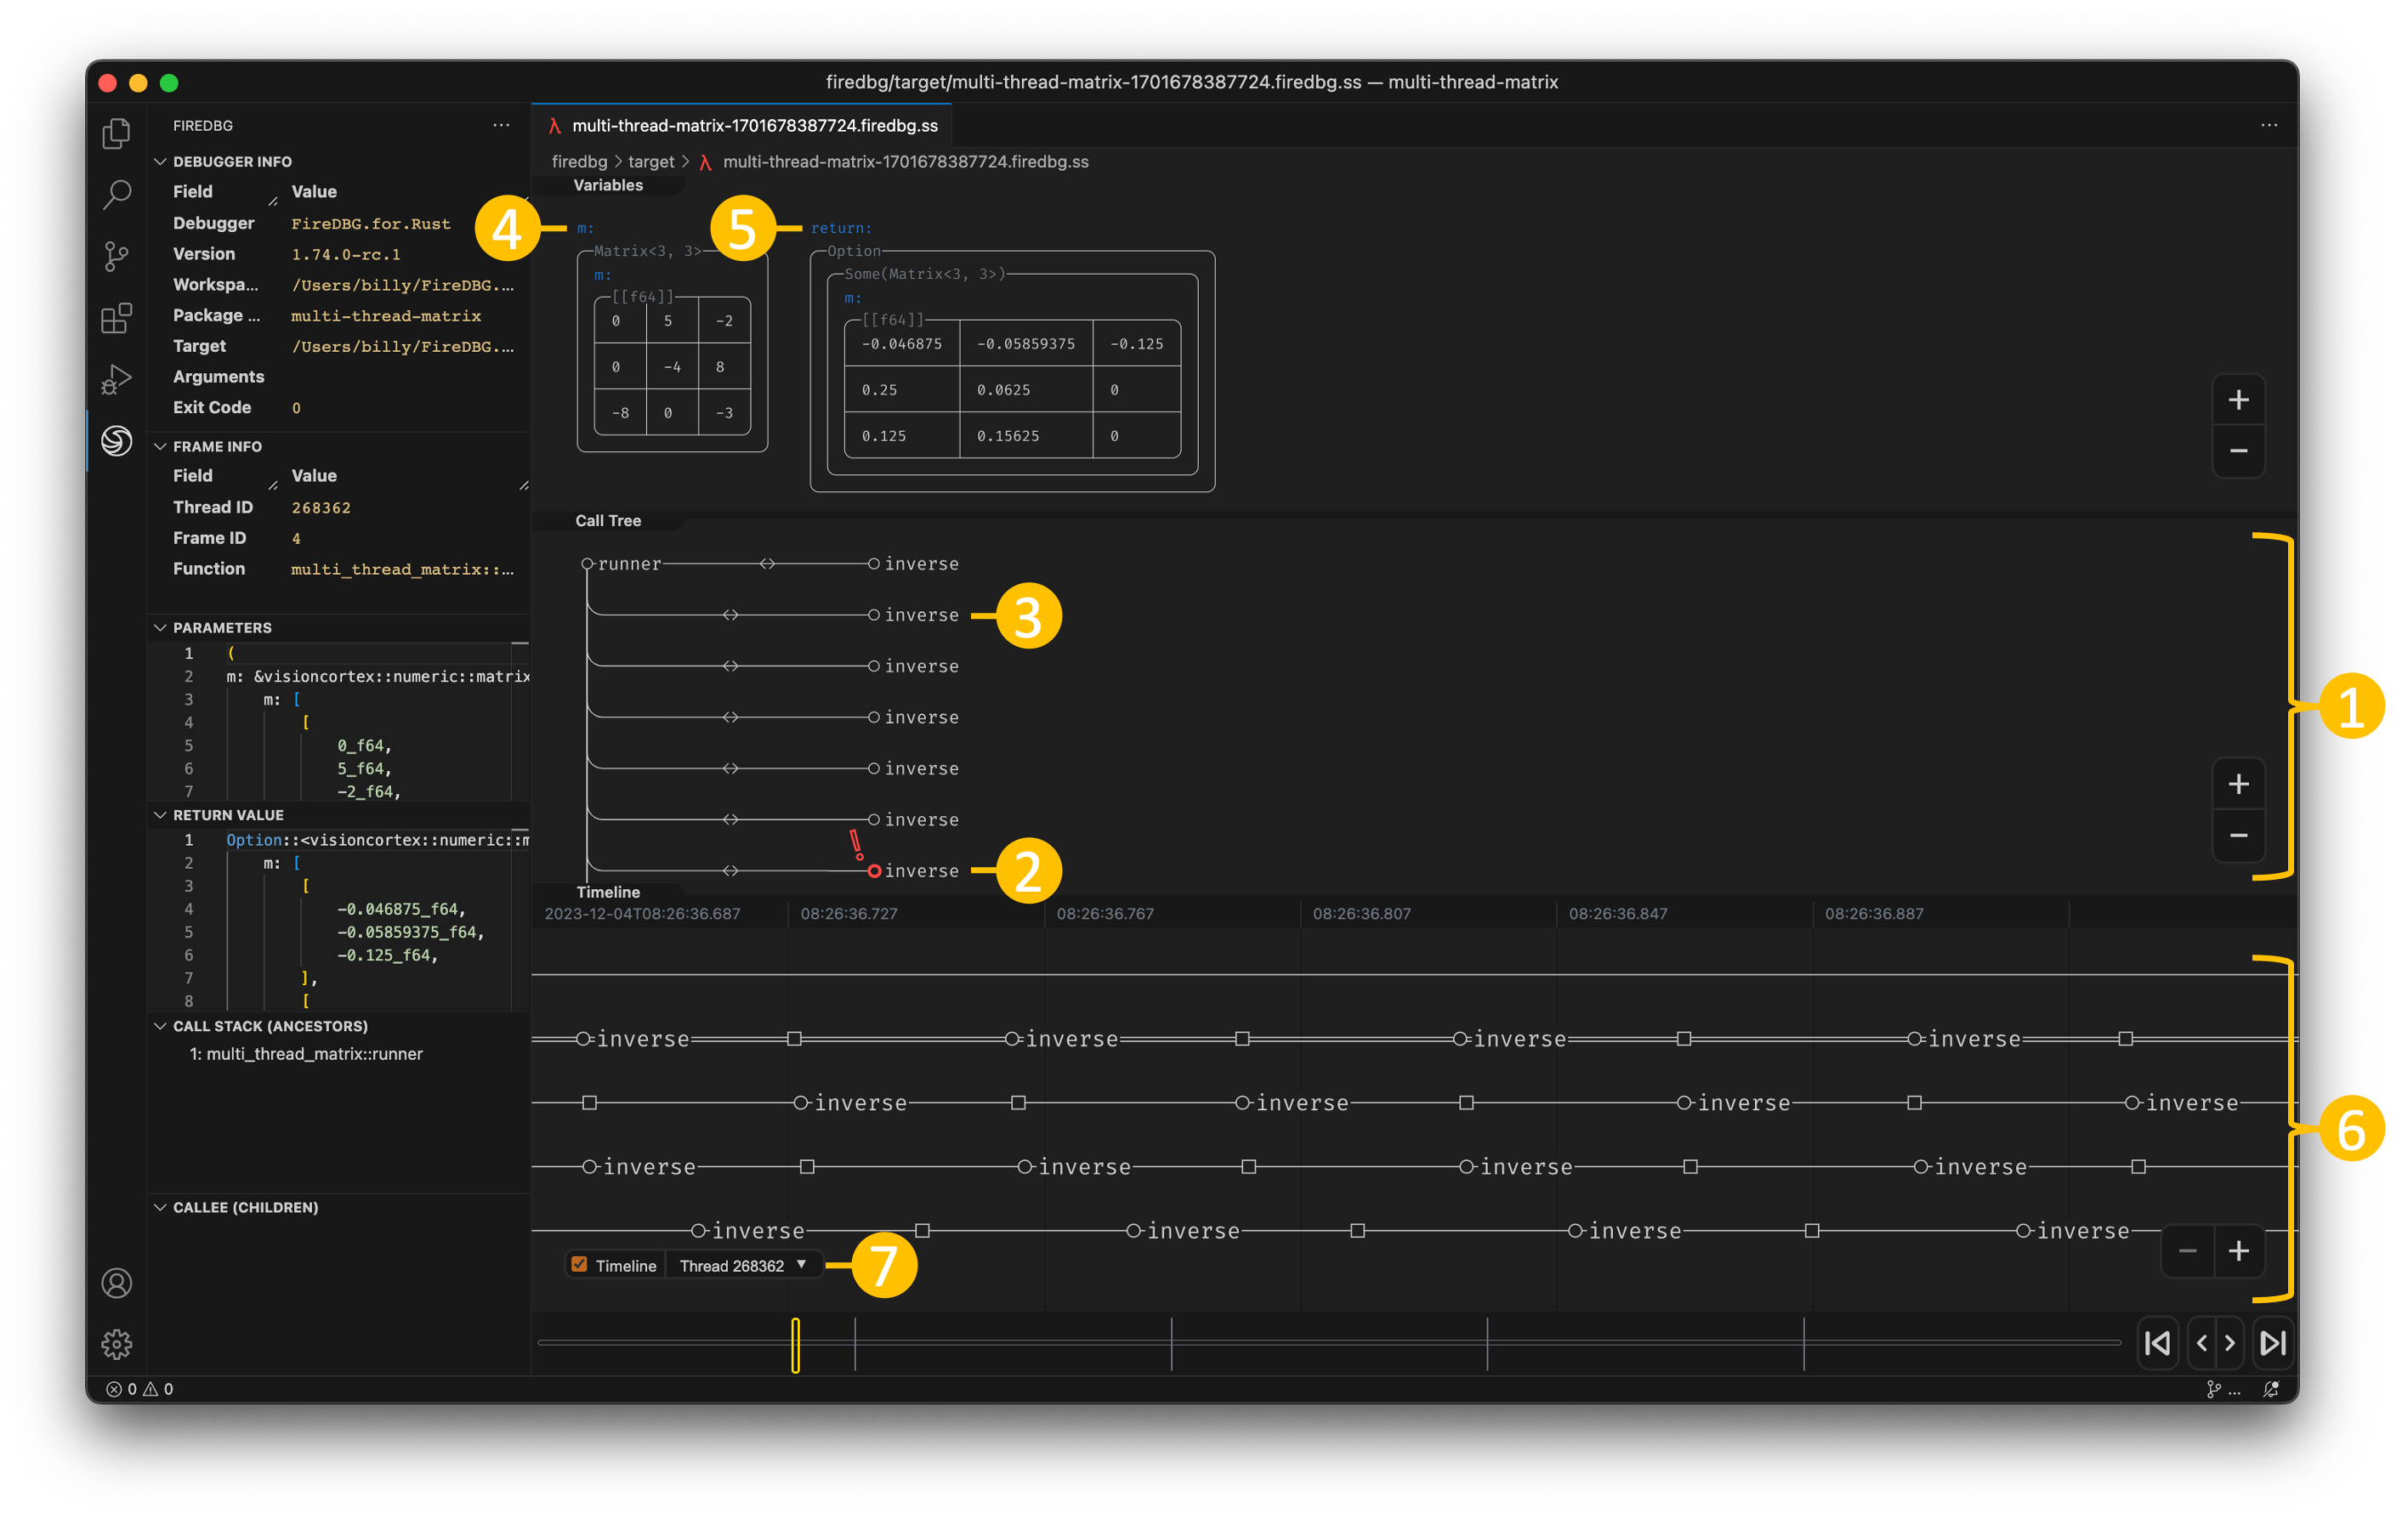
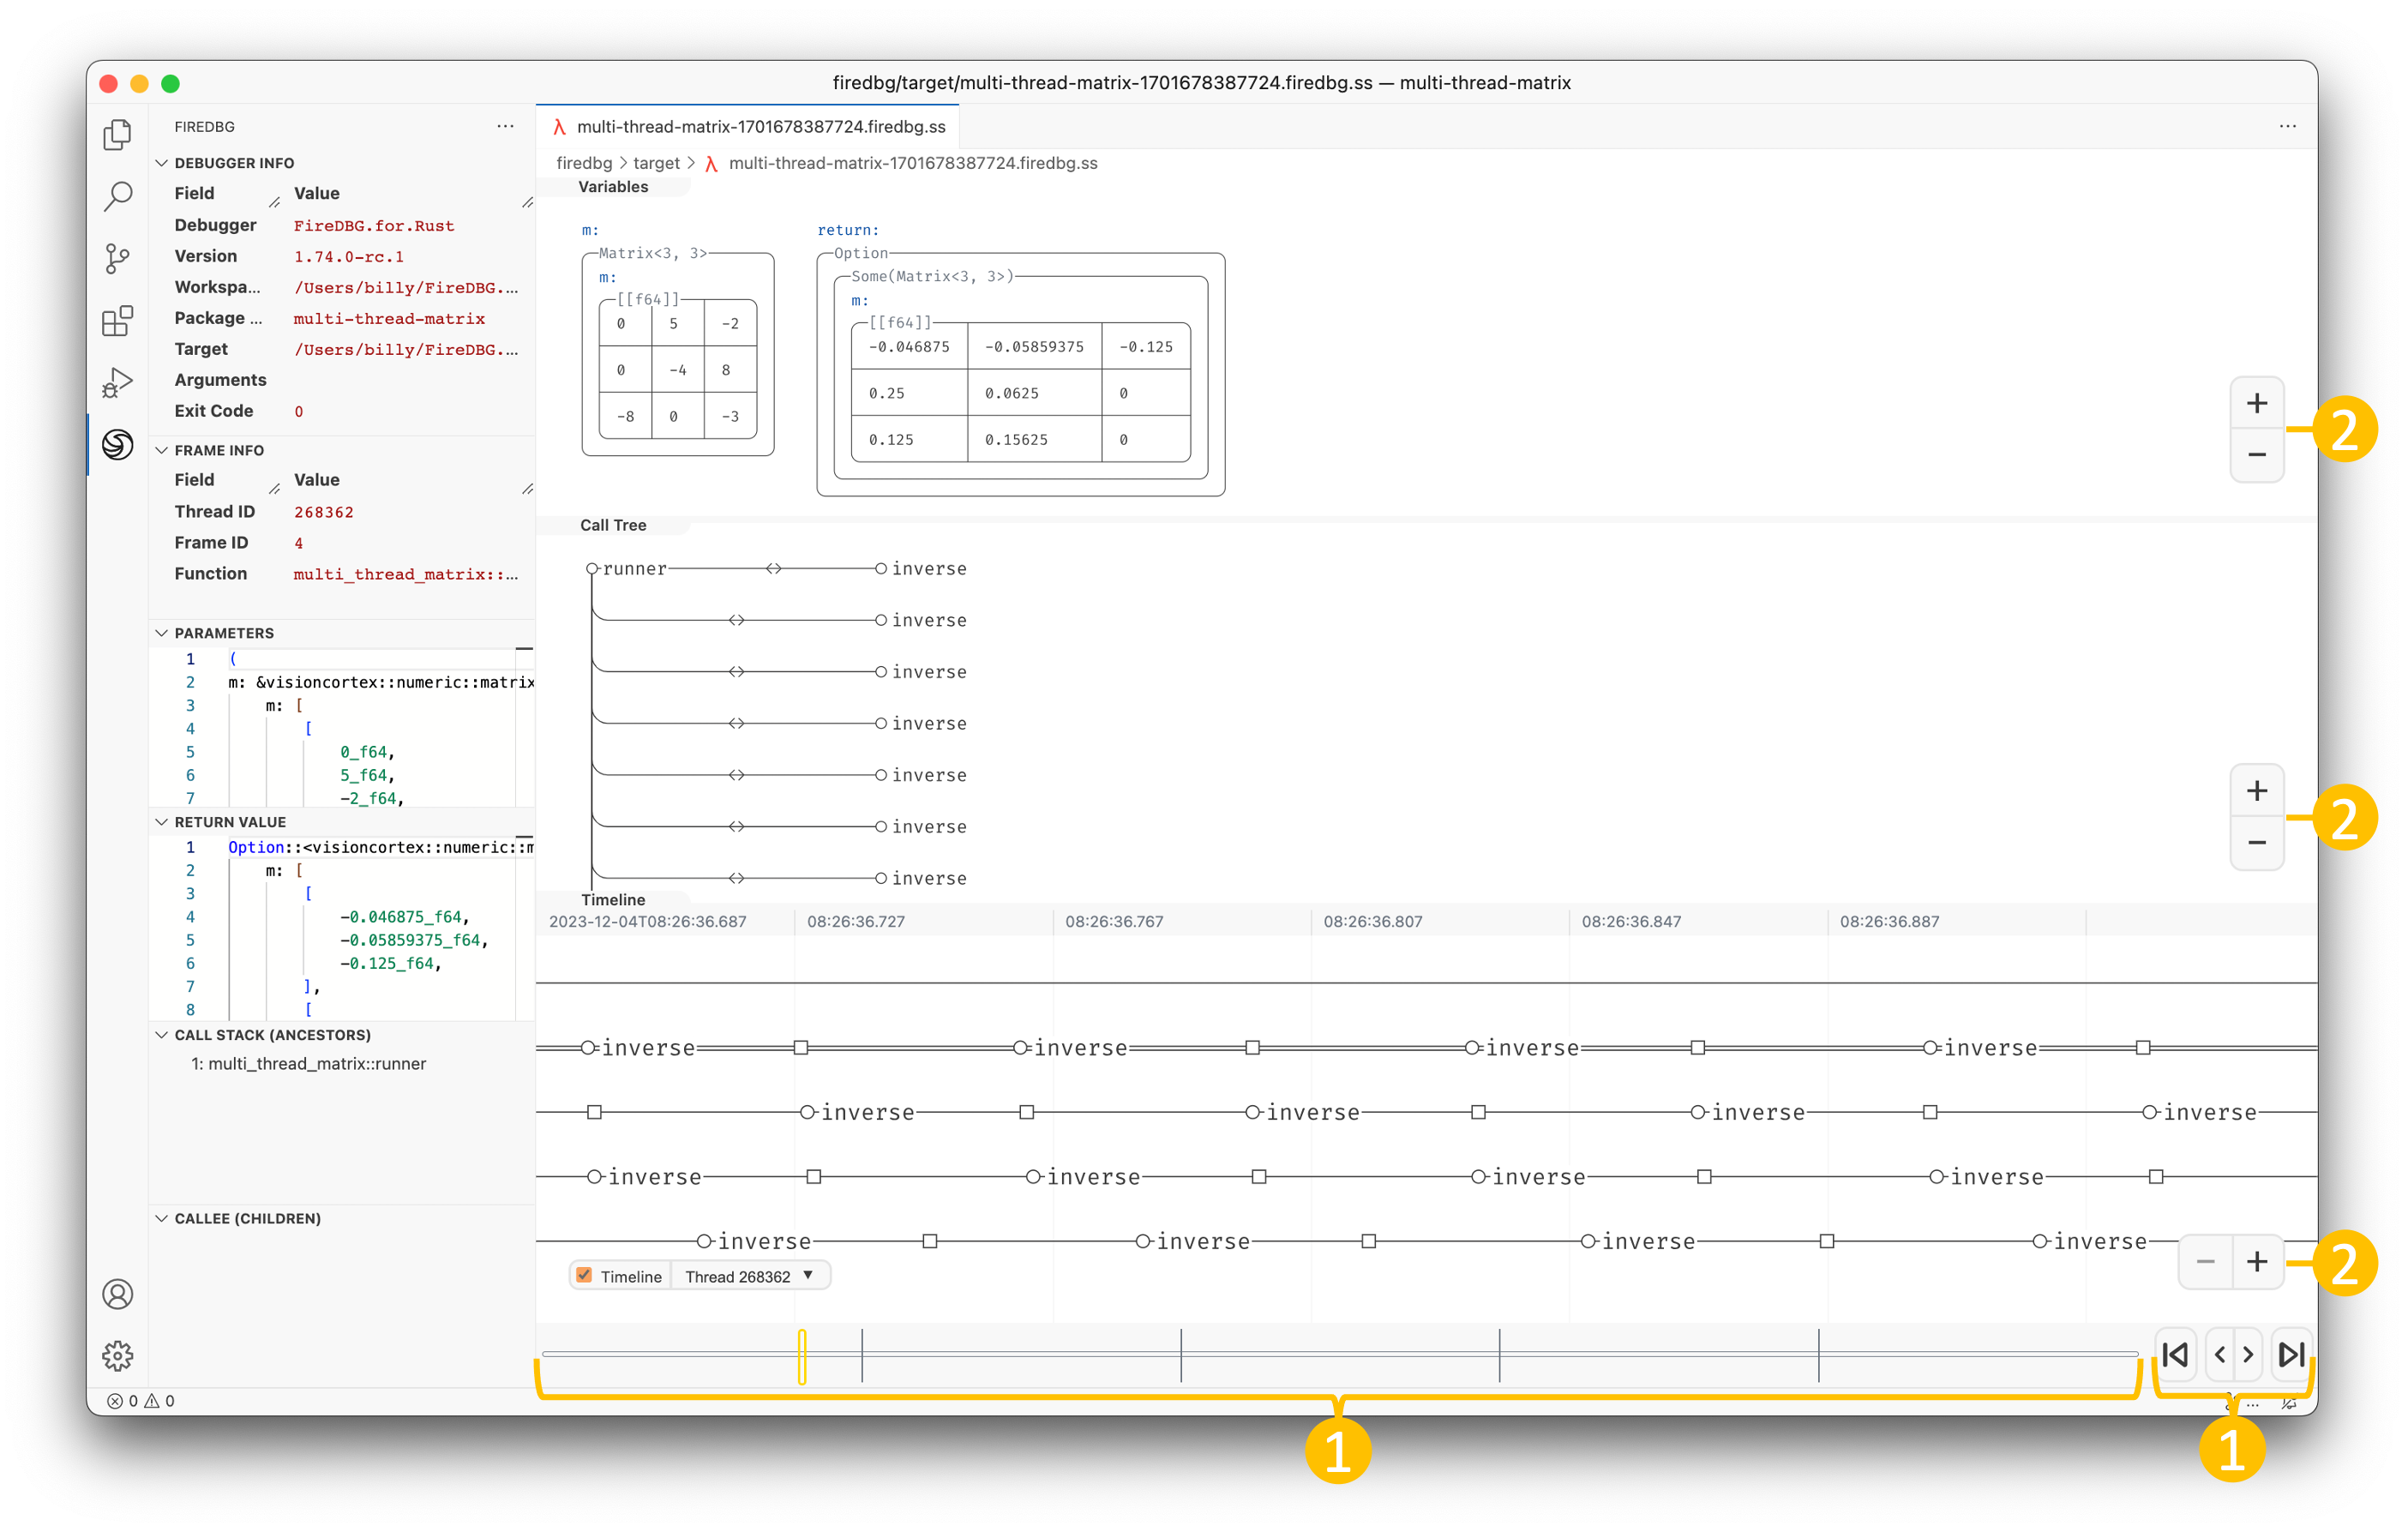
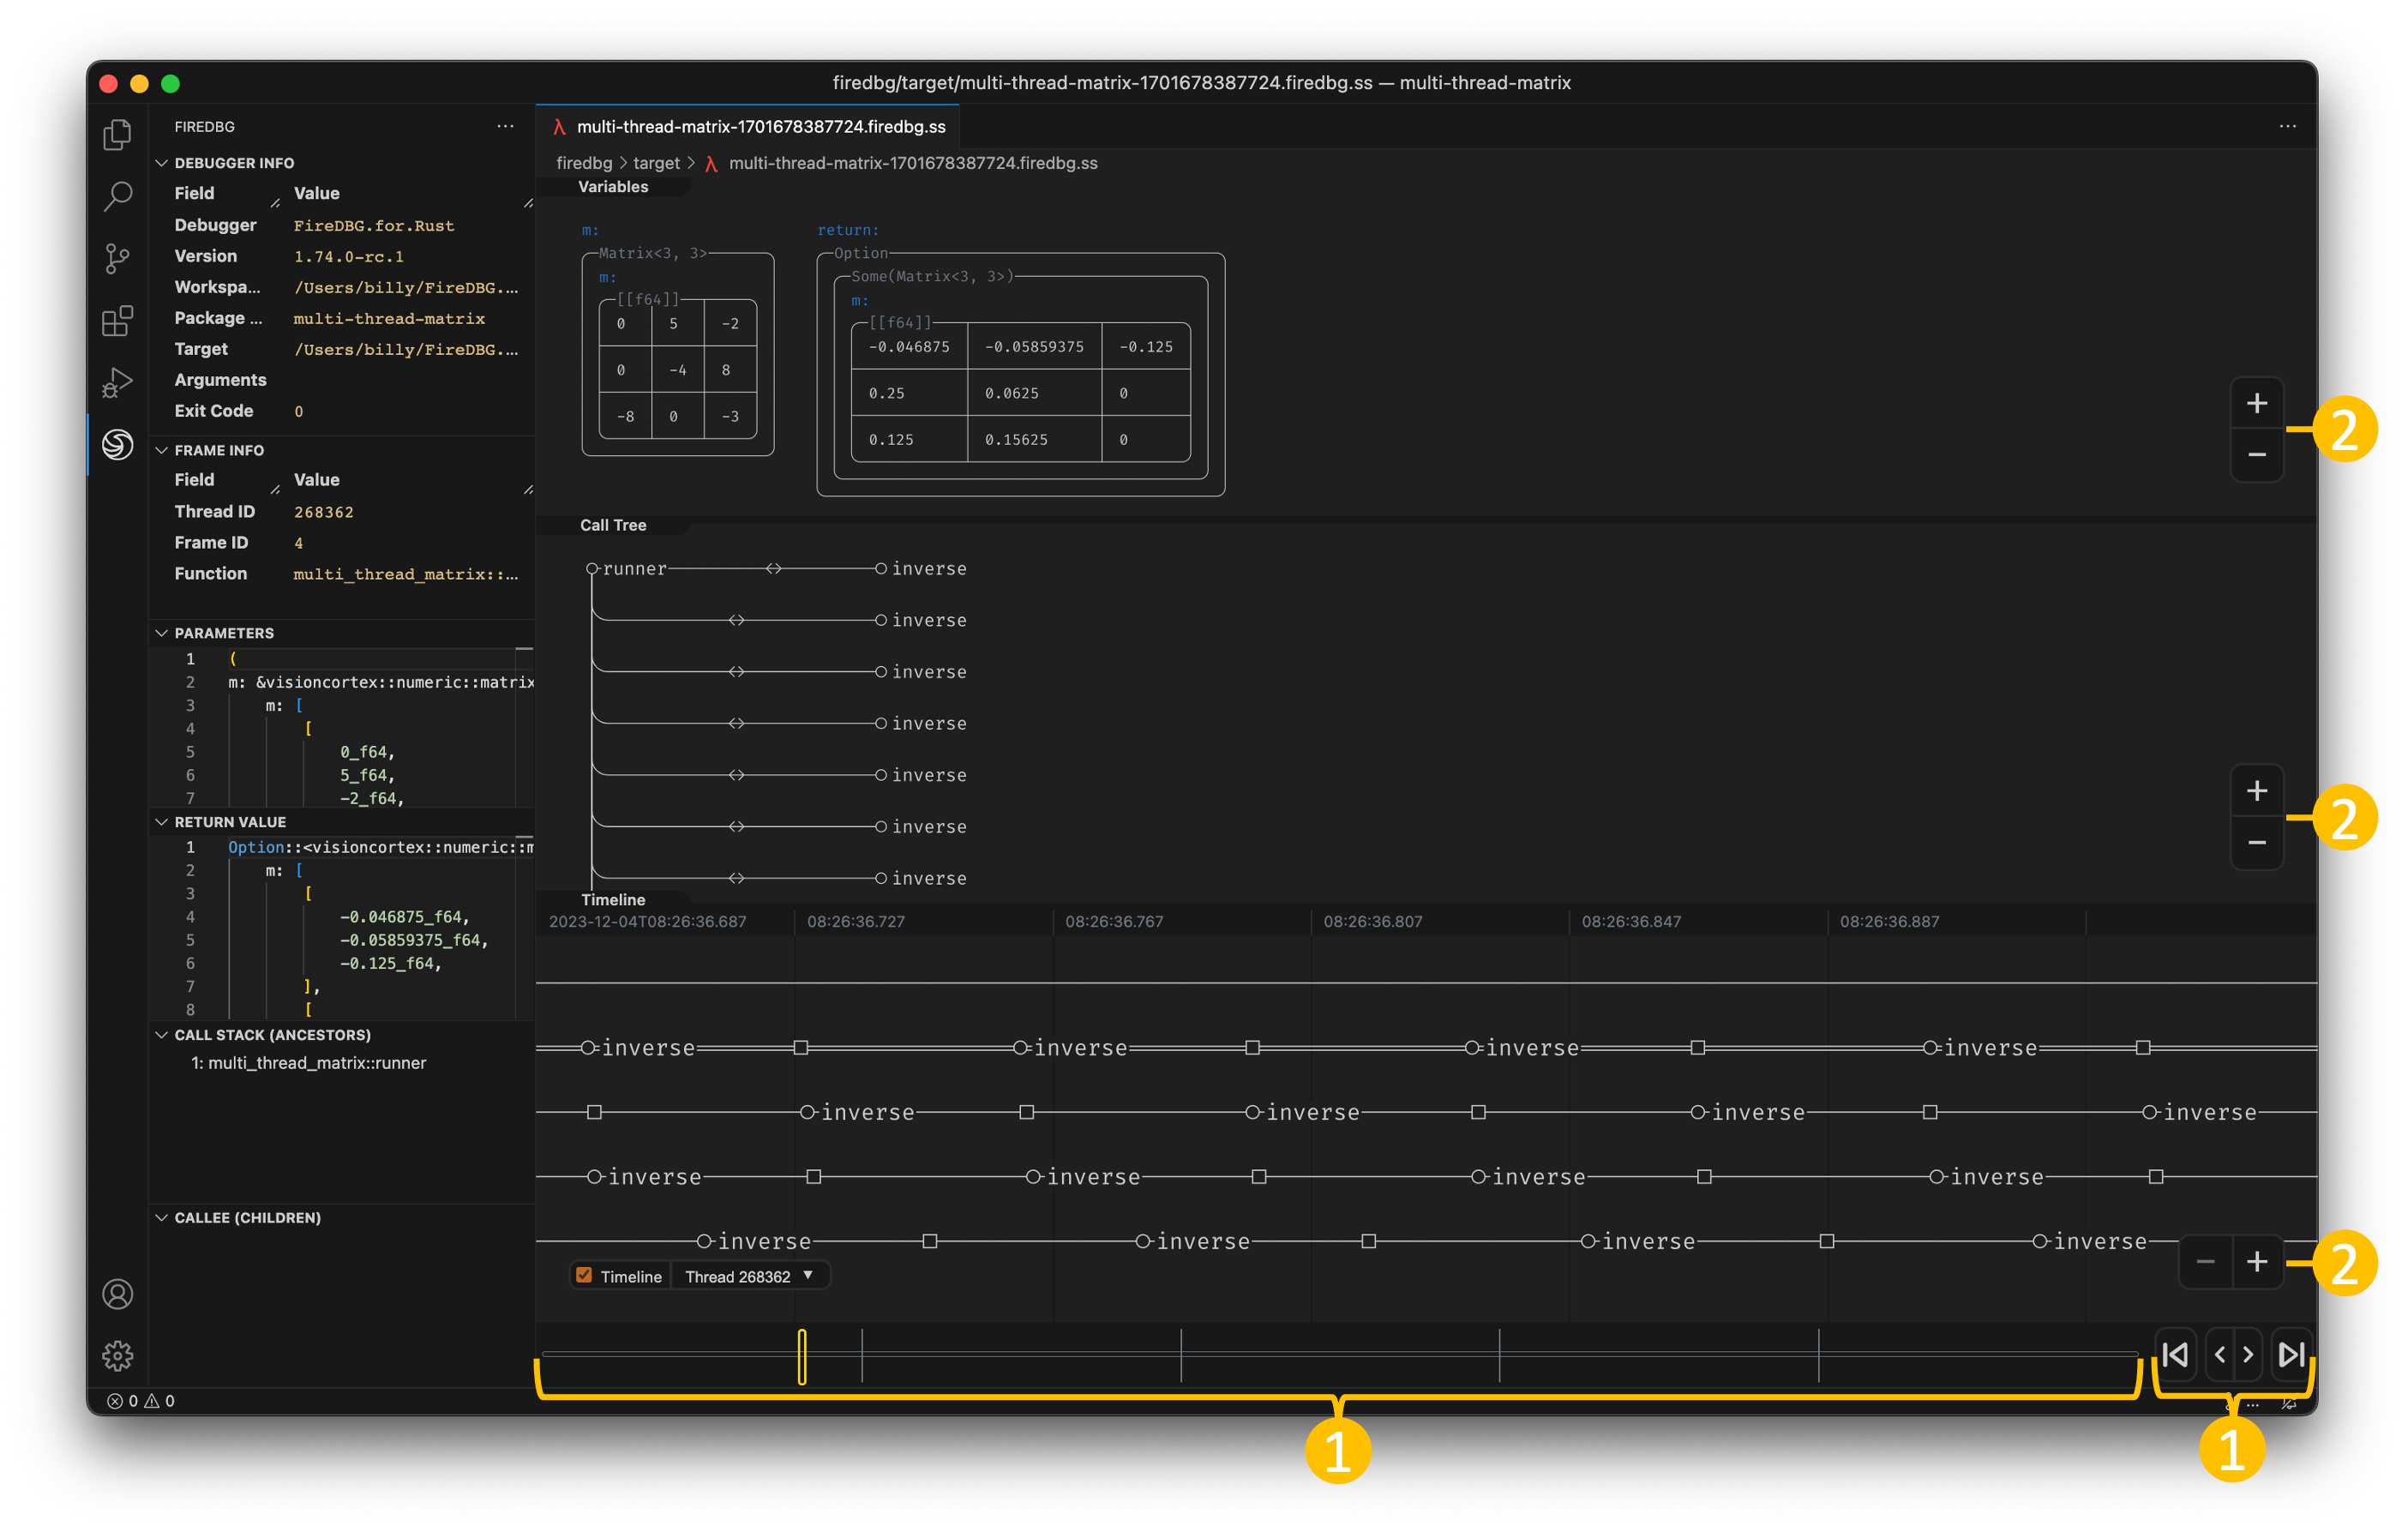
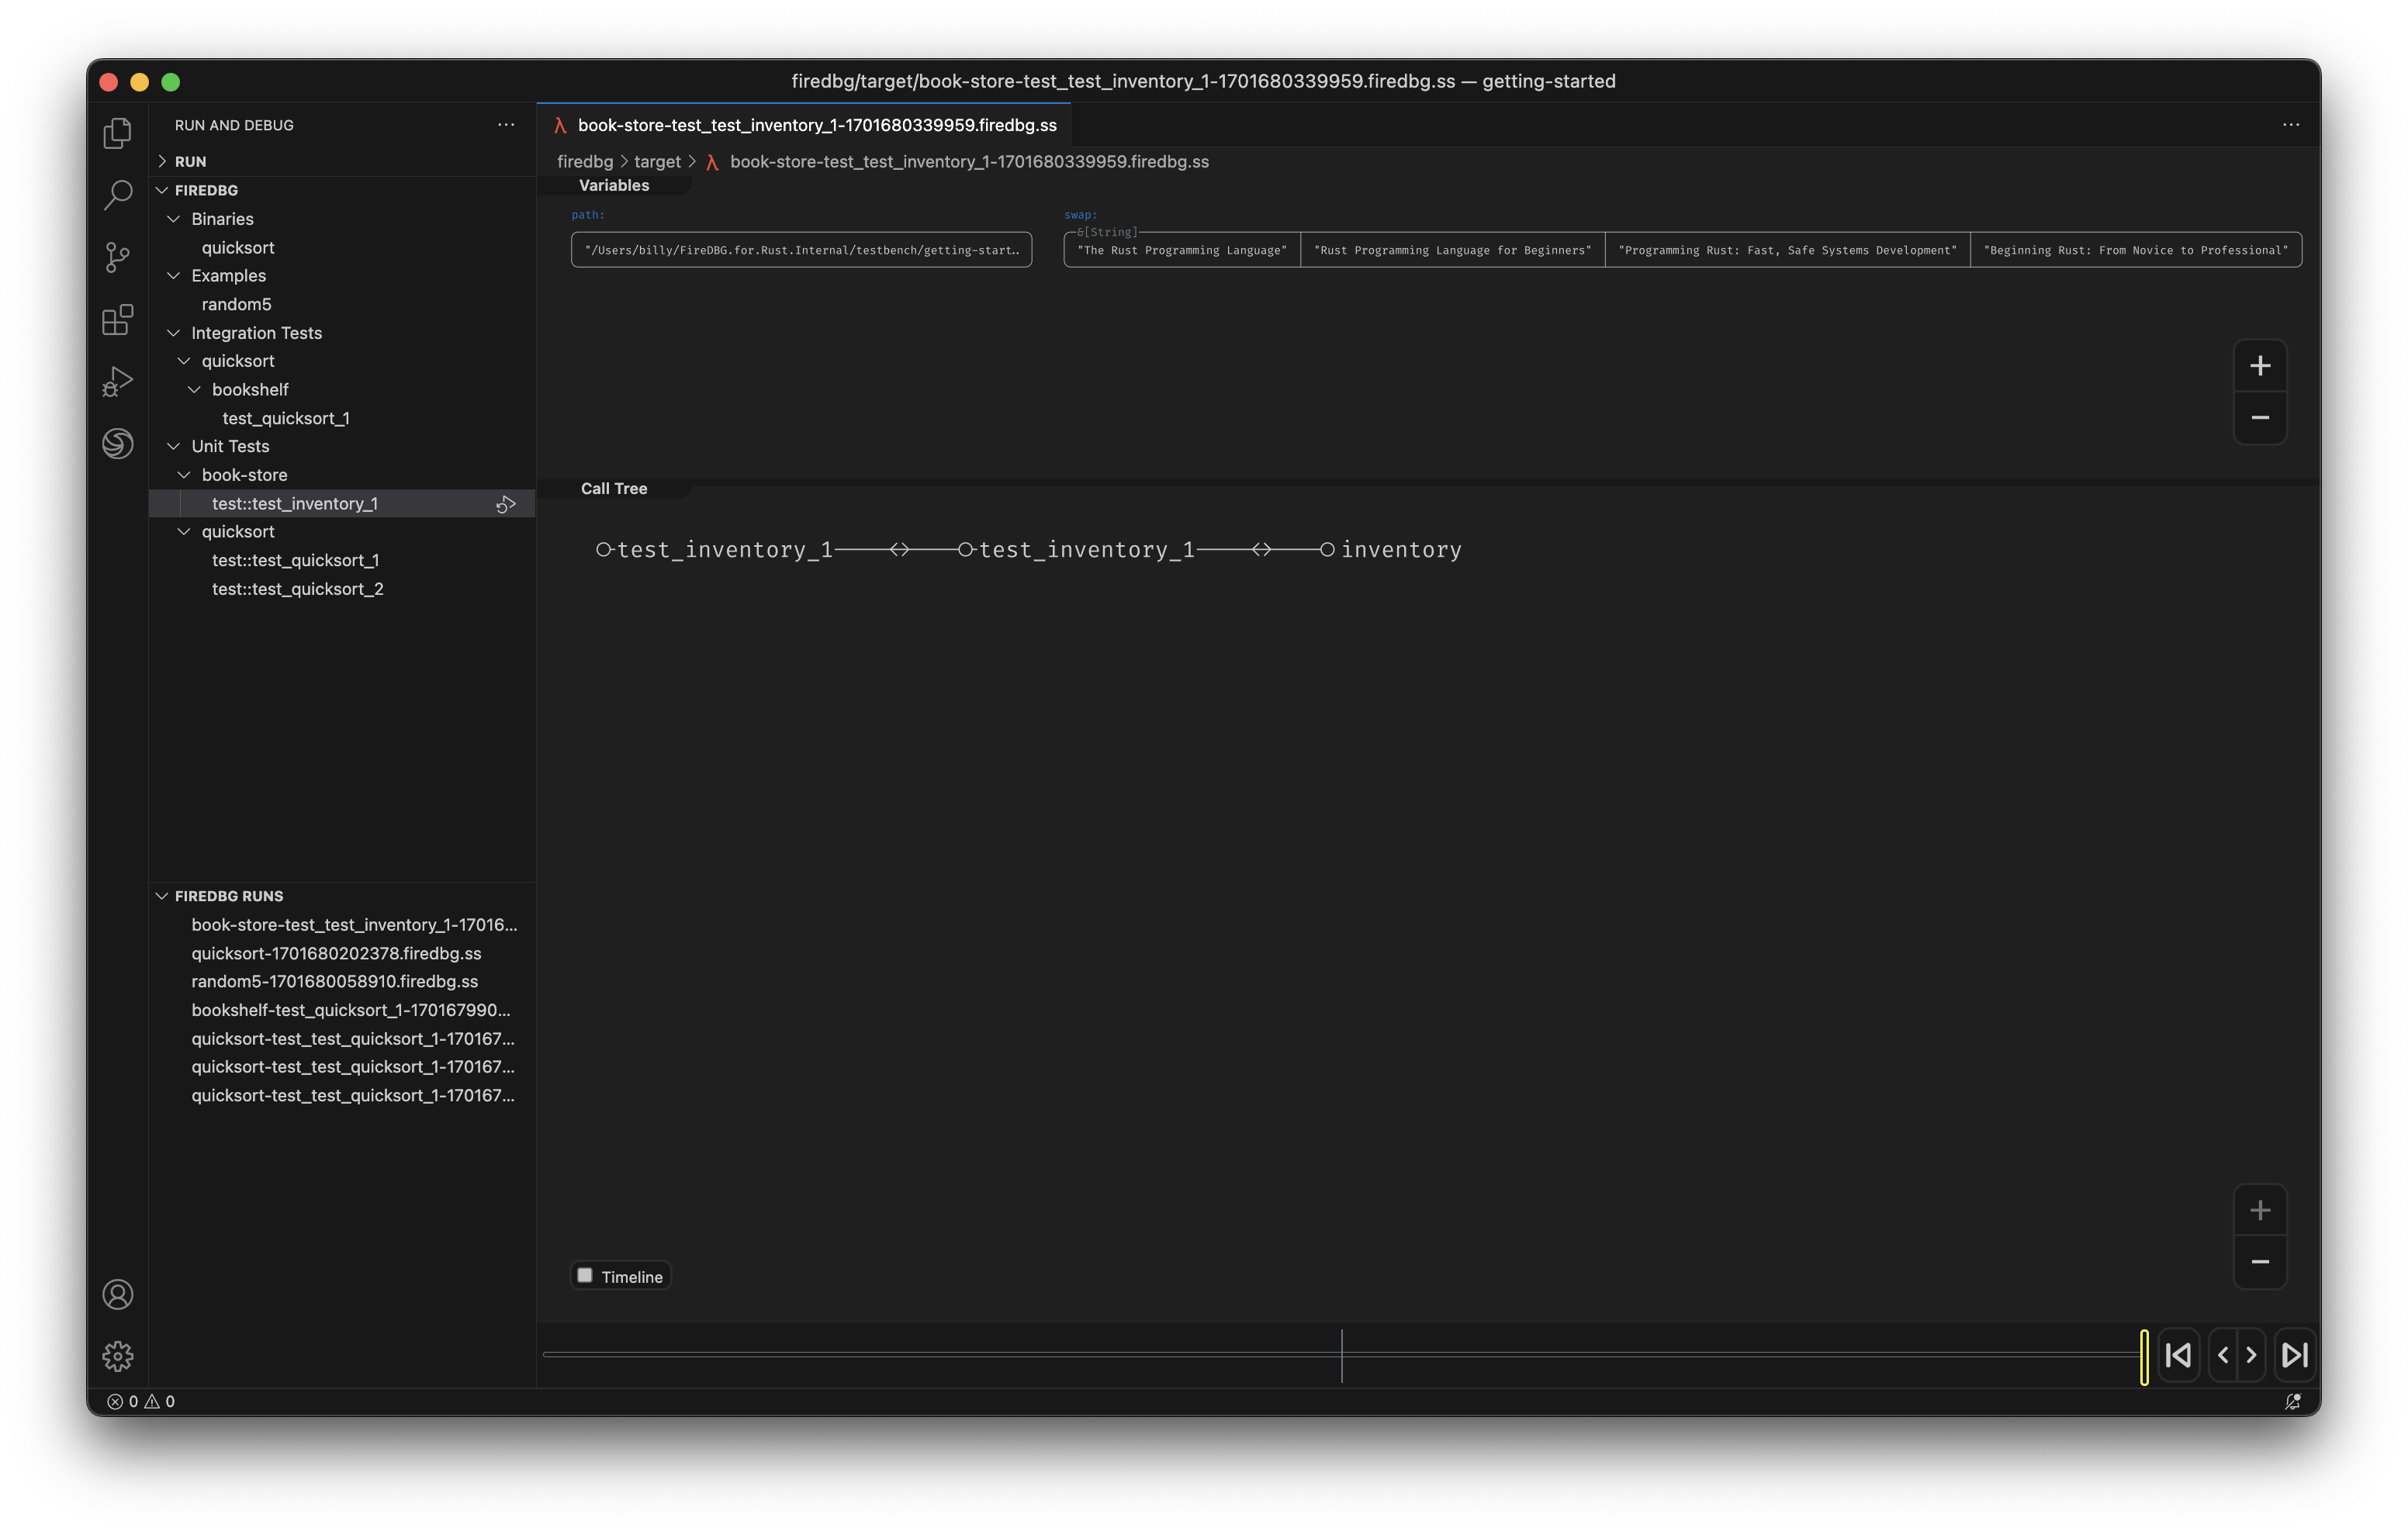
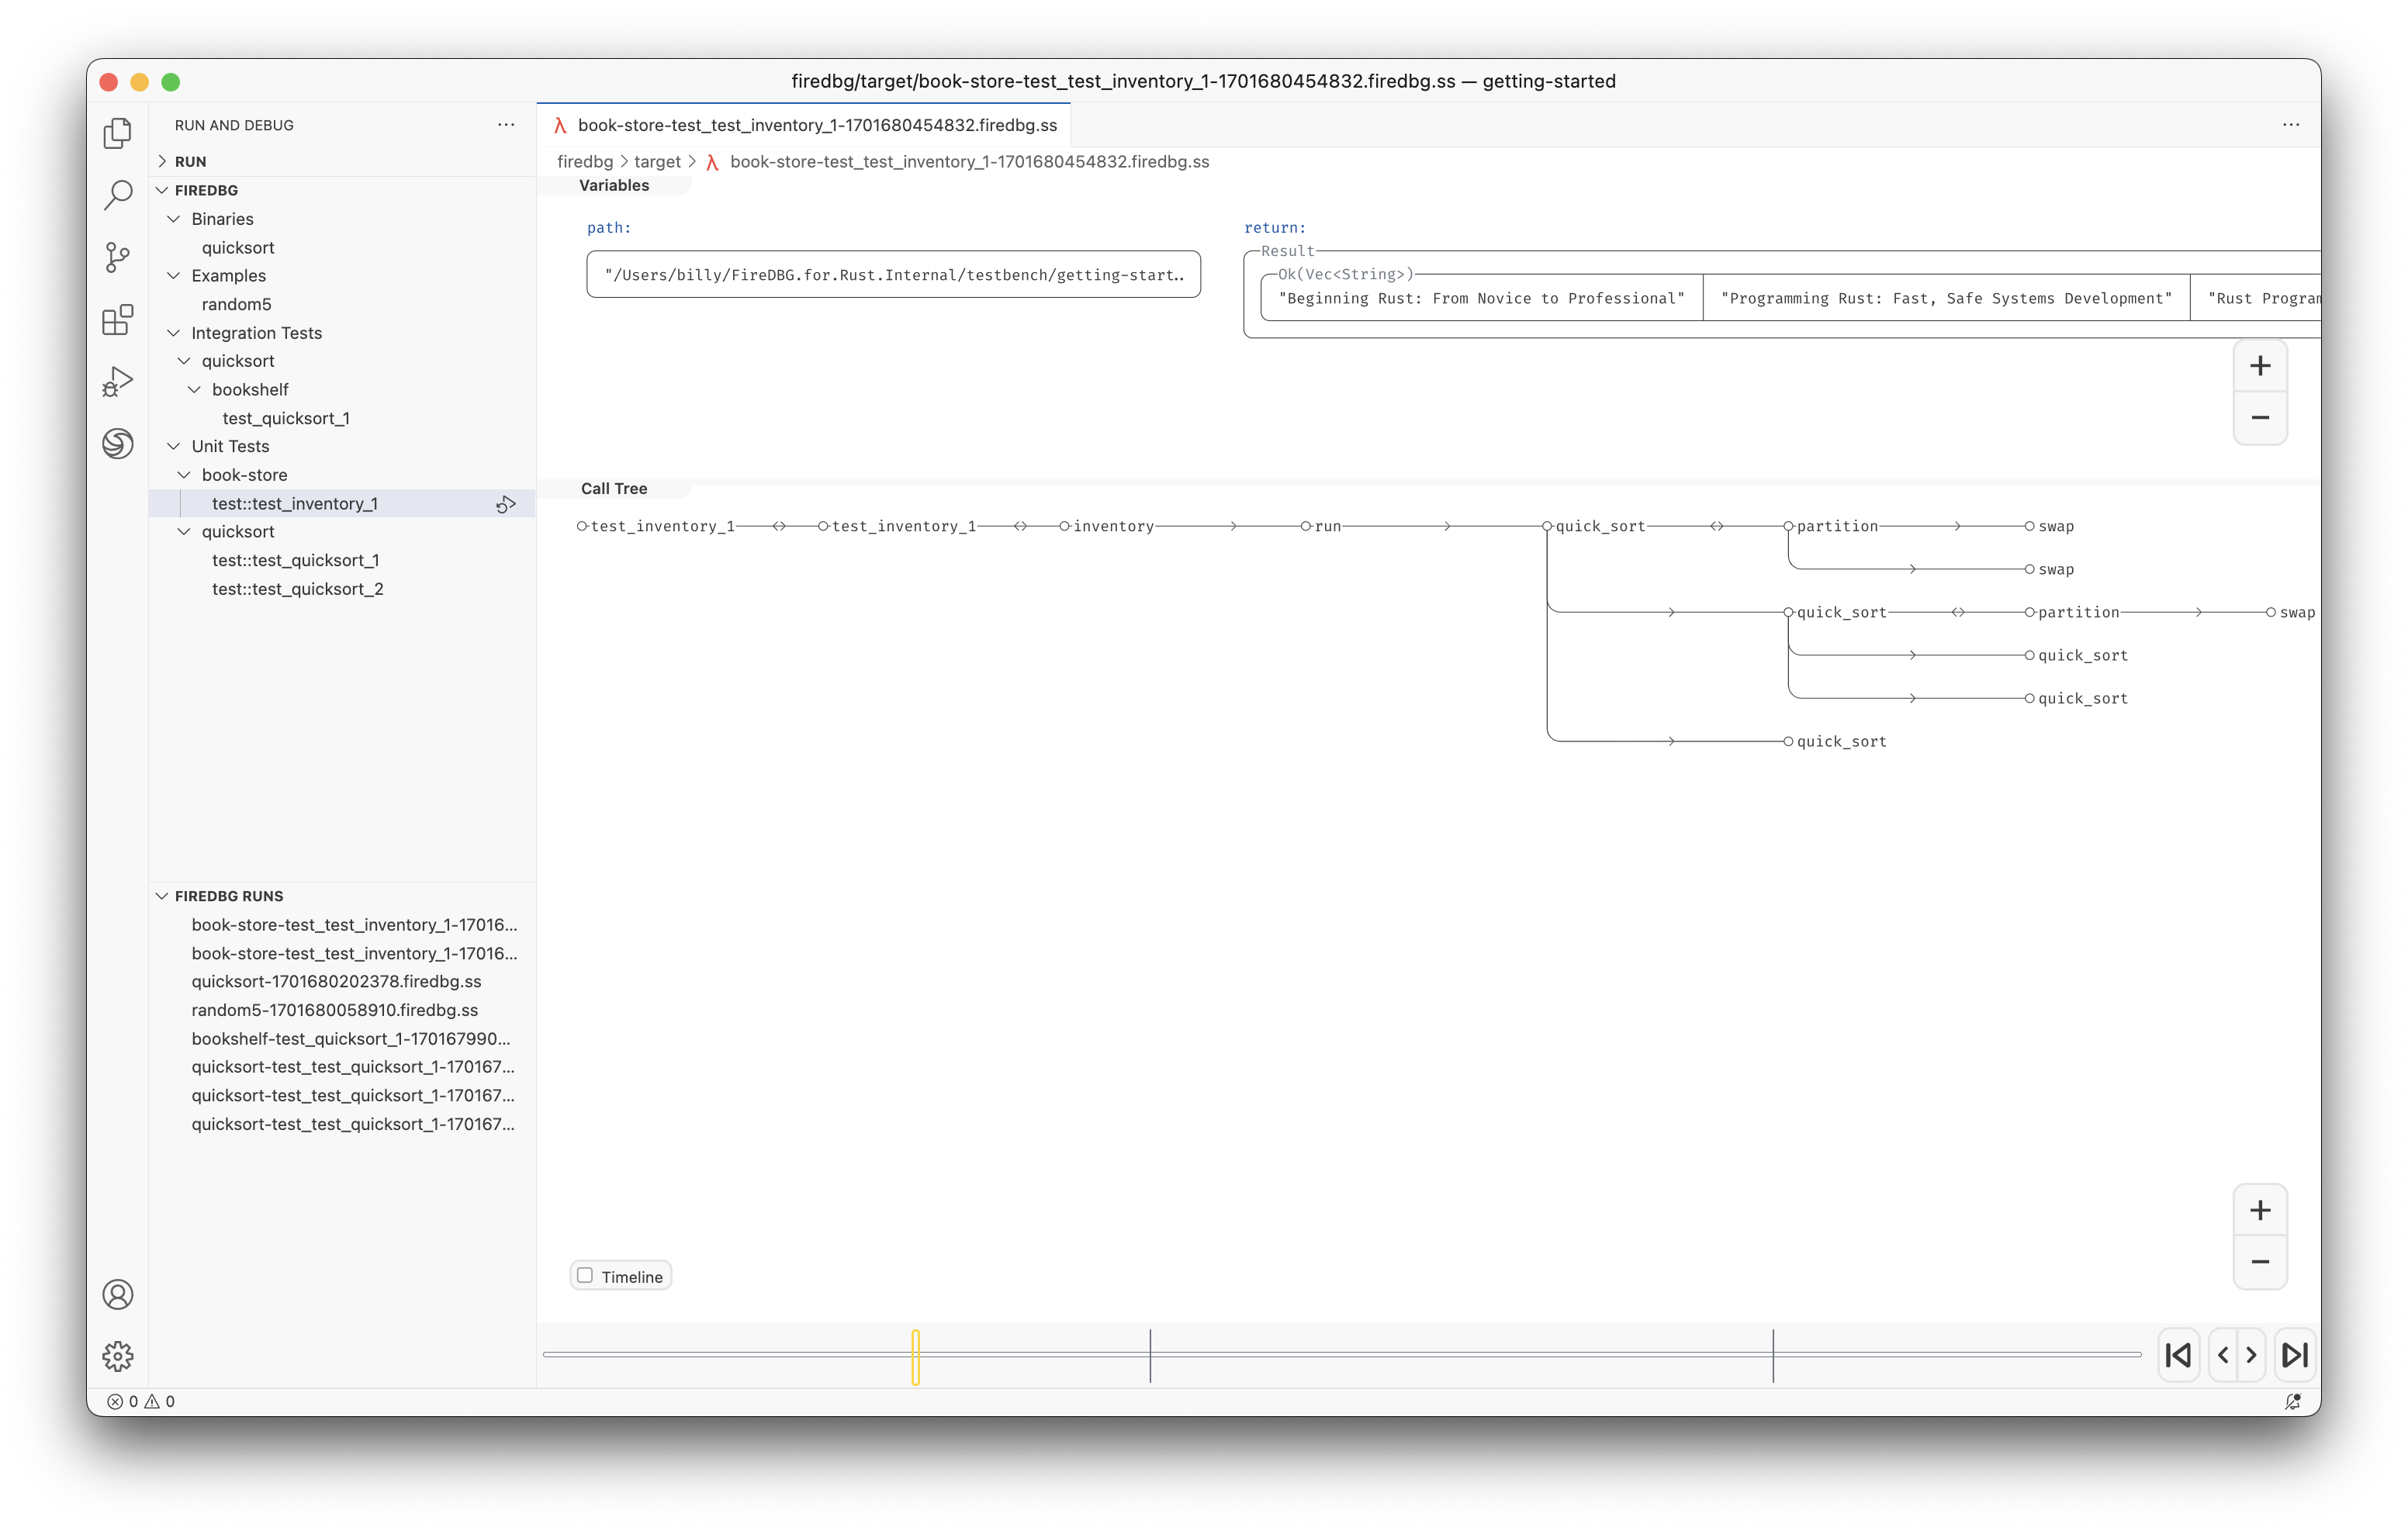
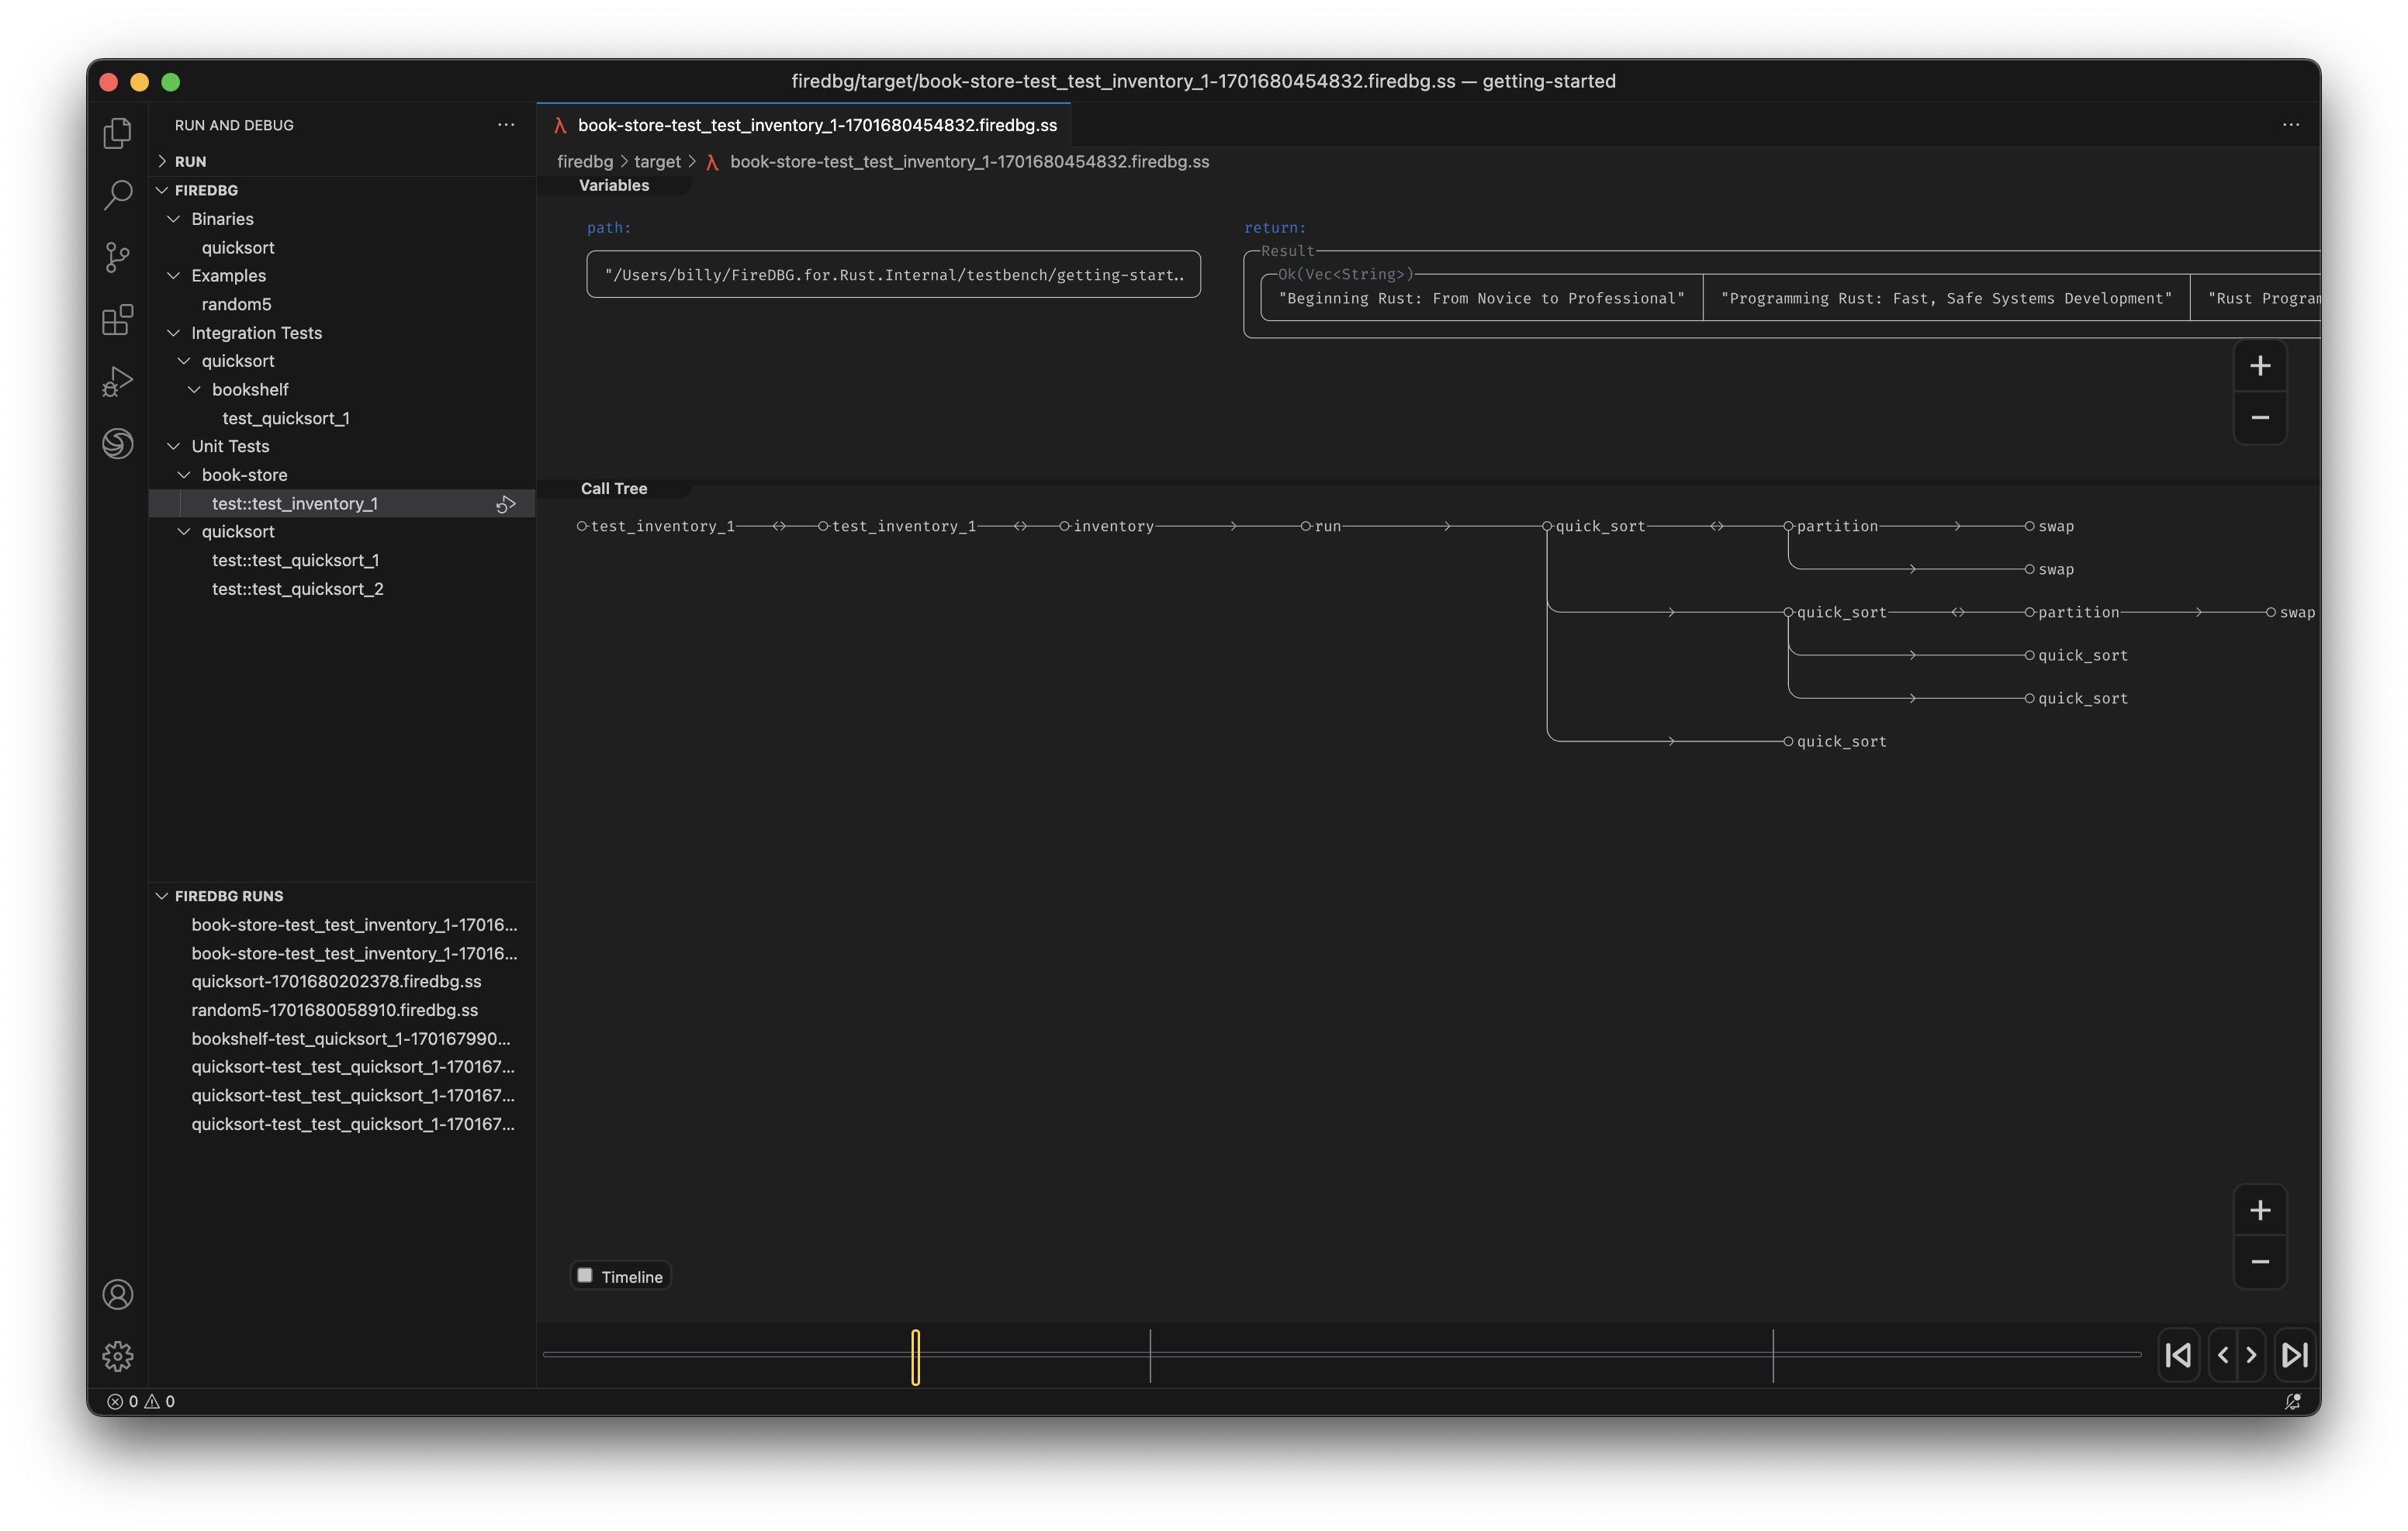
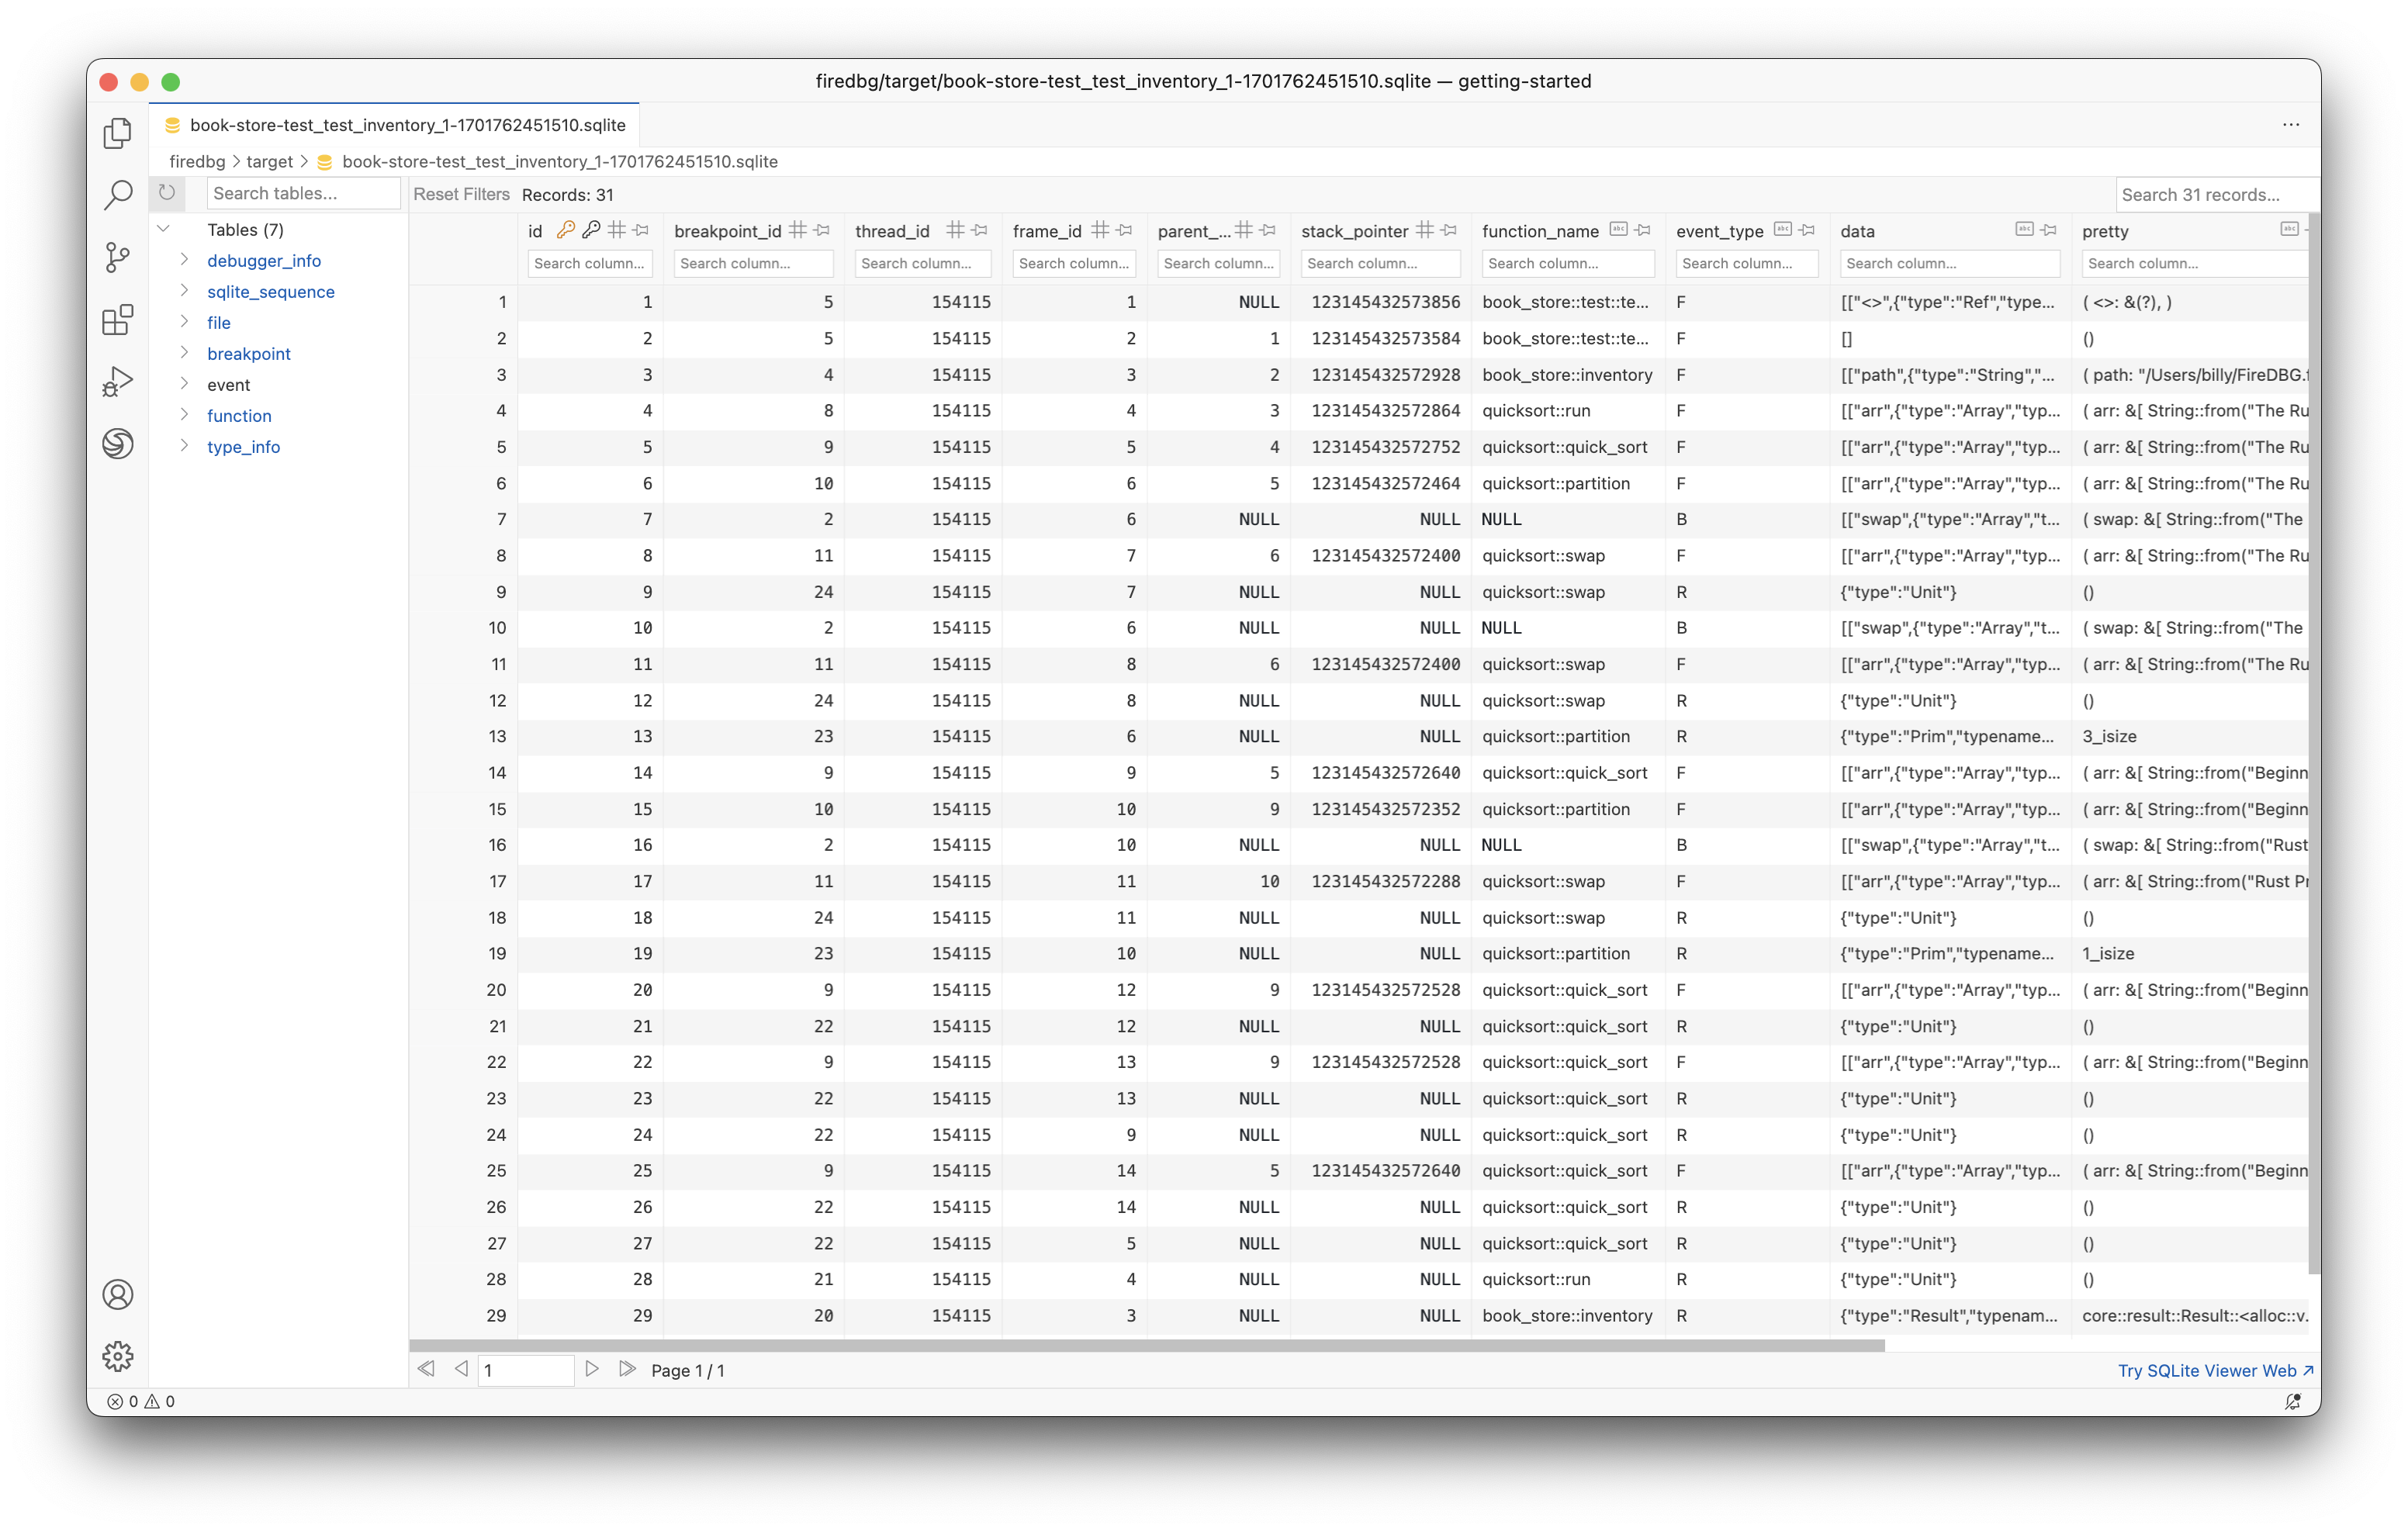
With FireDBG, we can actually visualize the events happened in parallel threads!
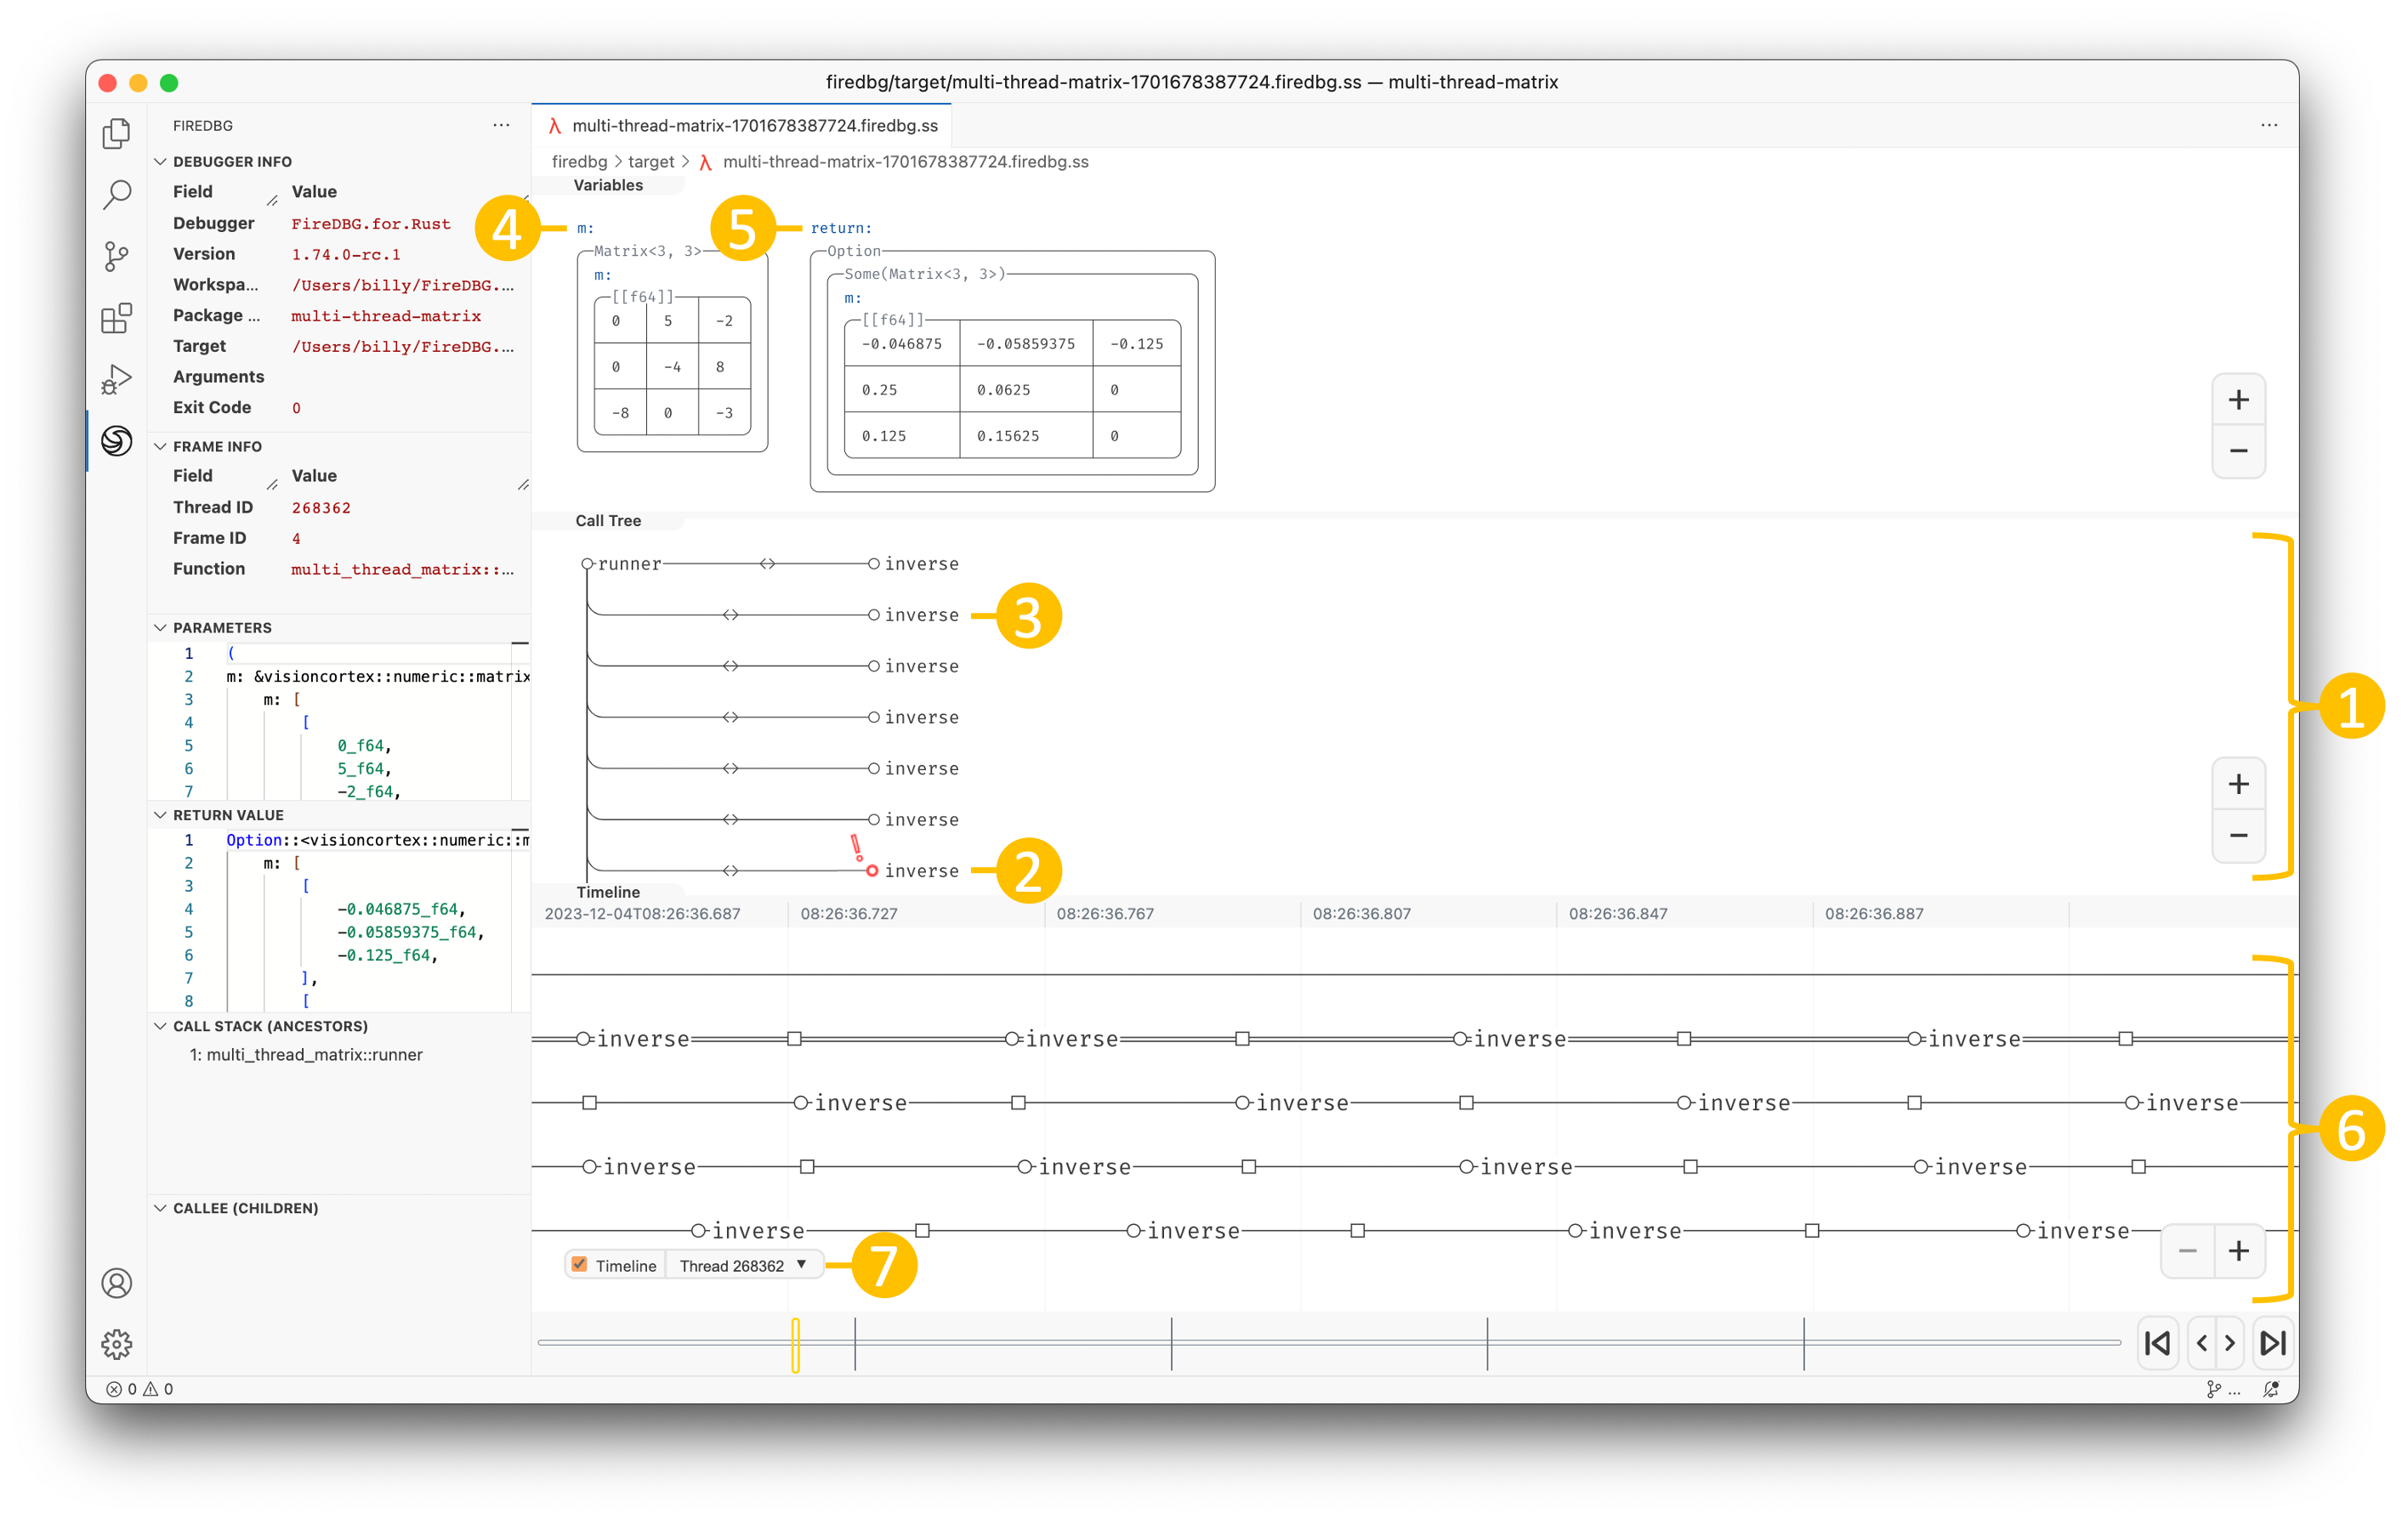
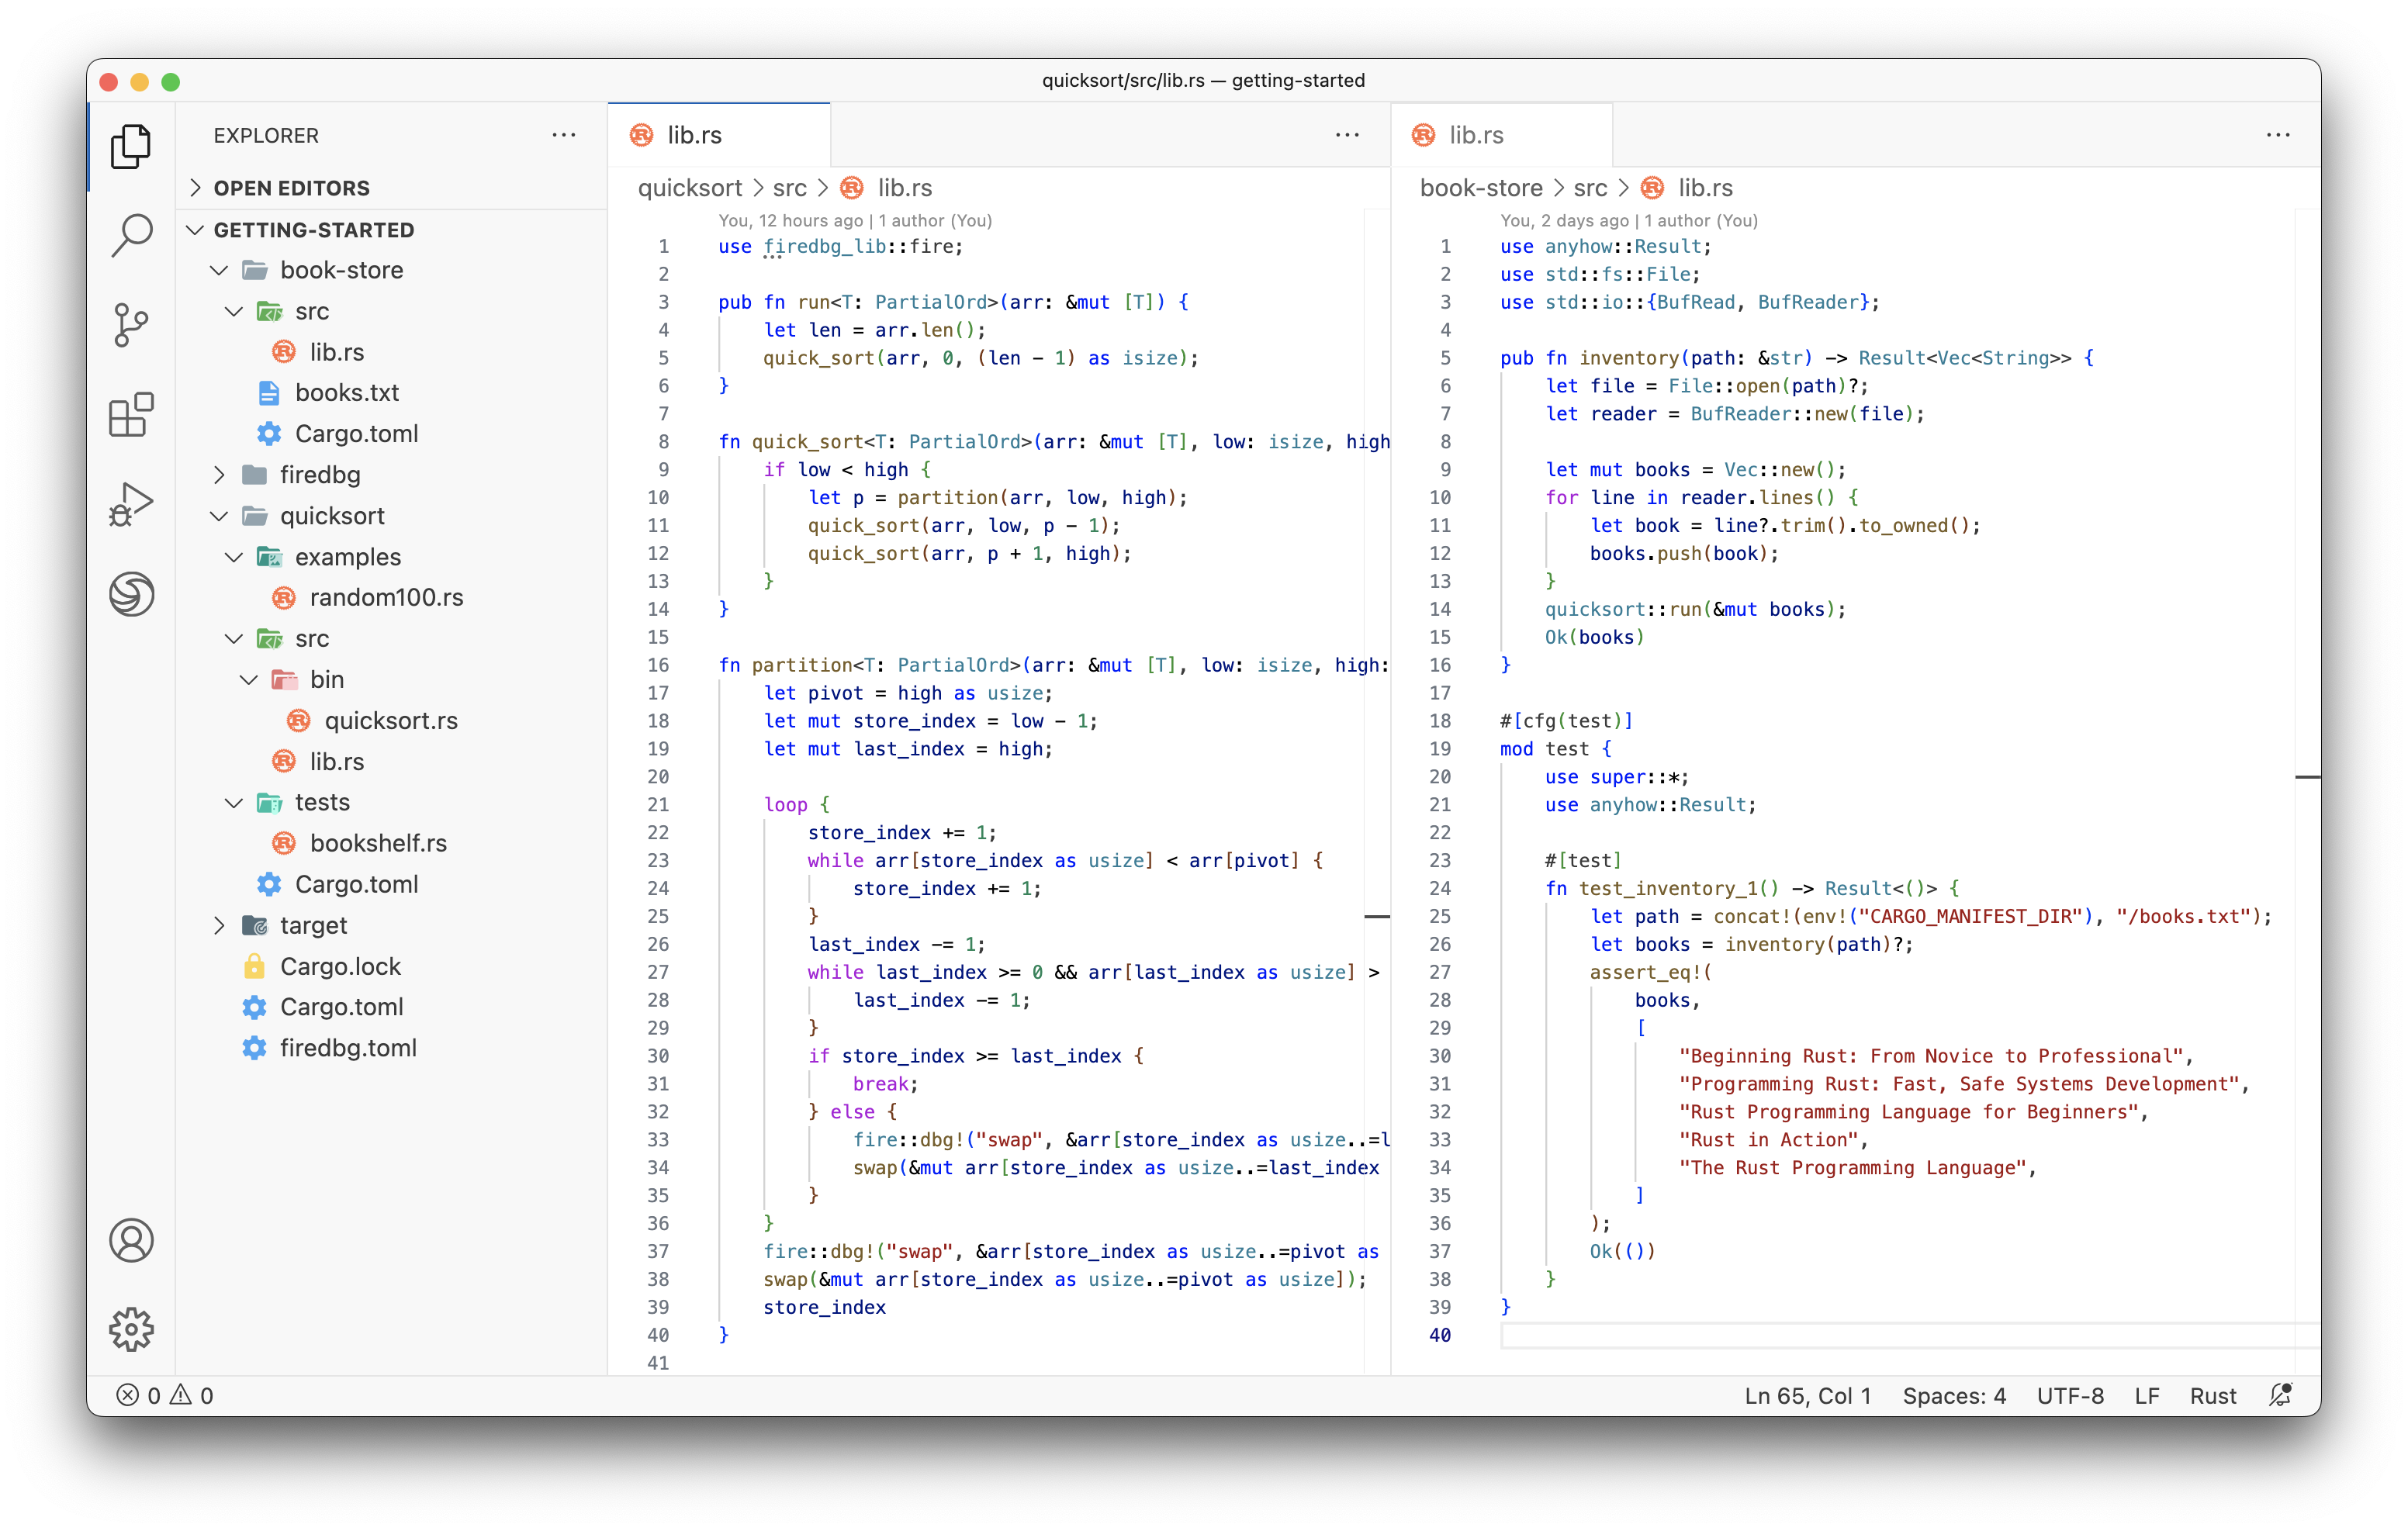
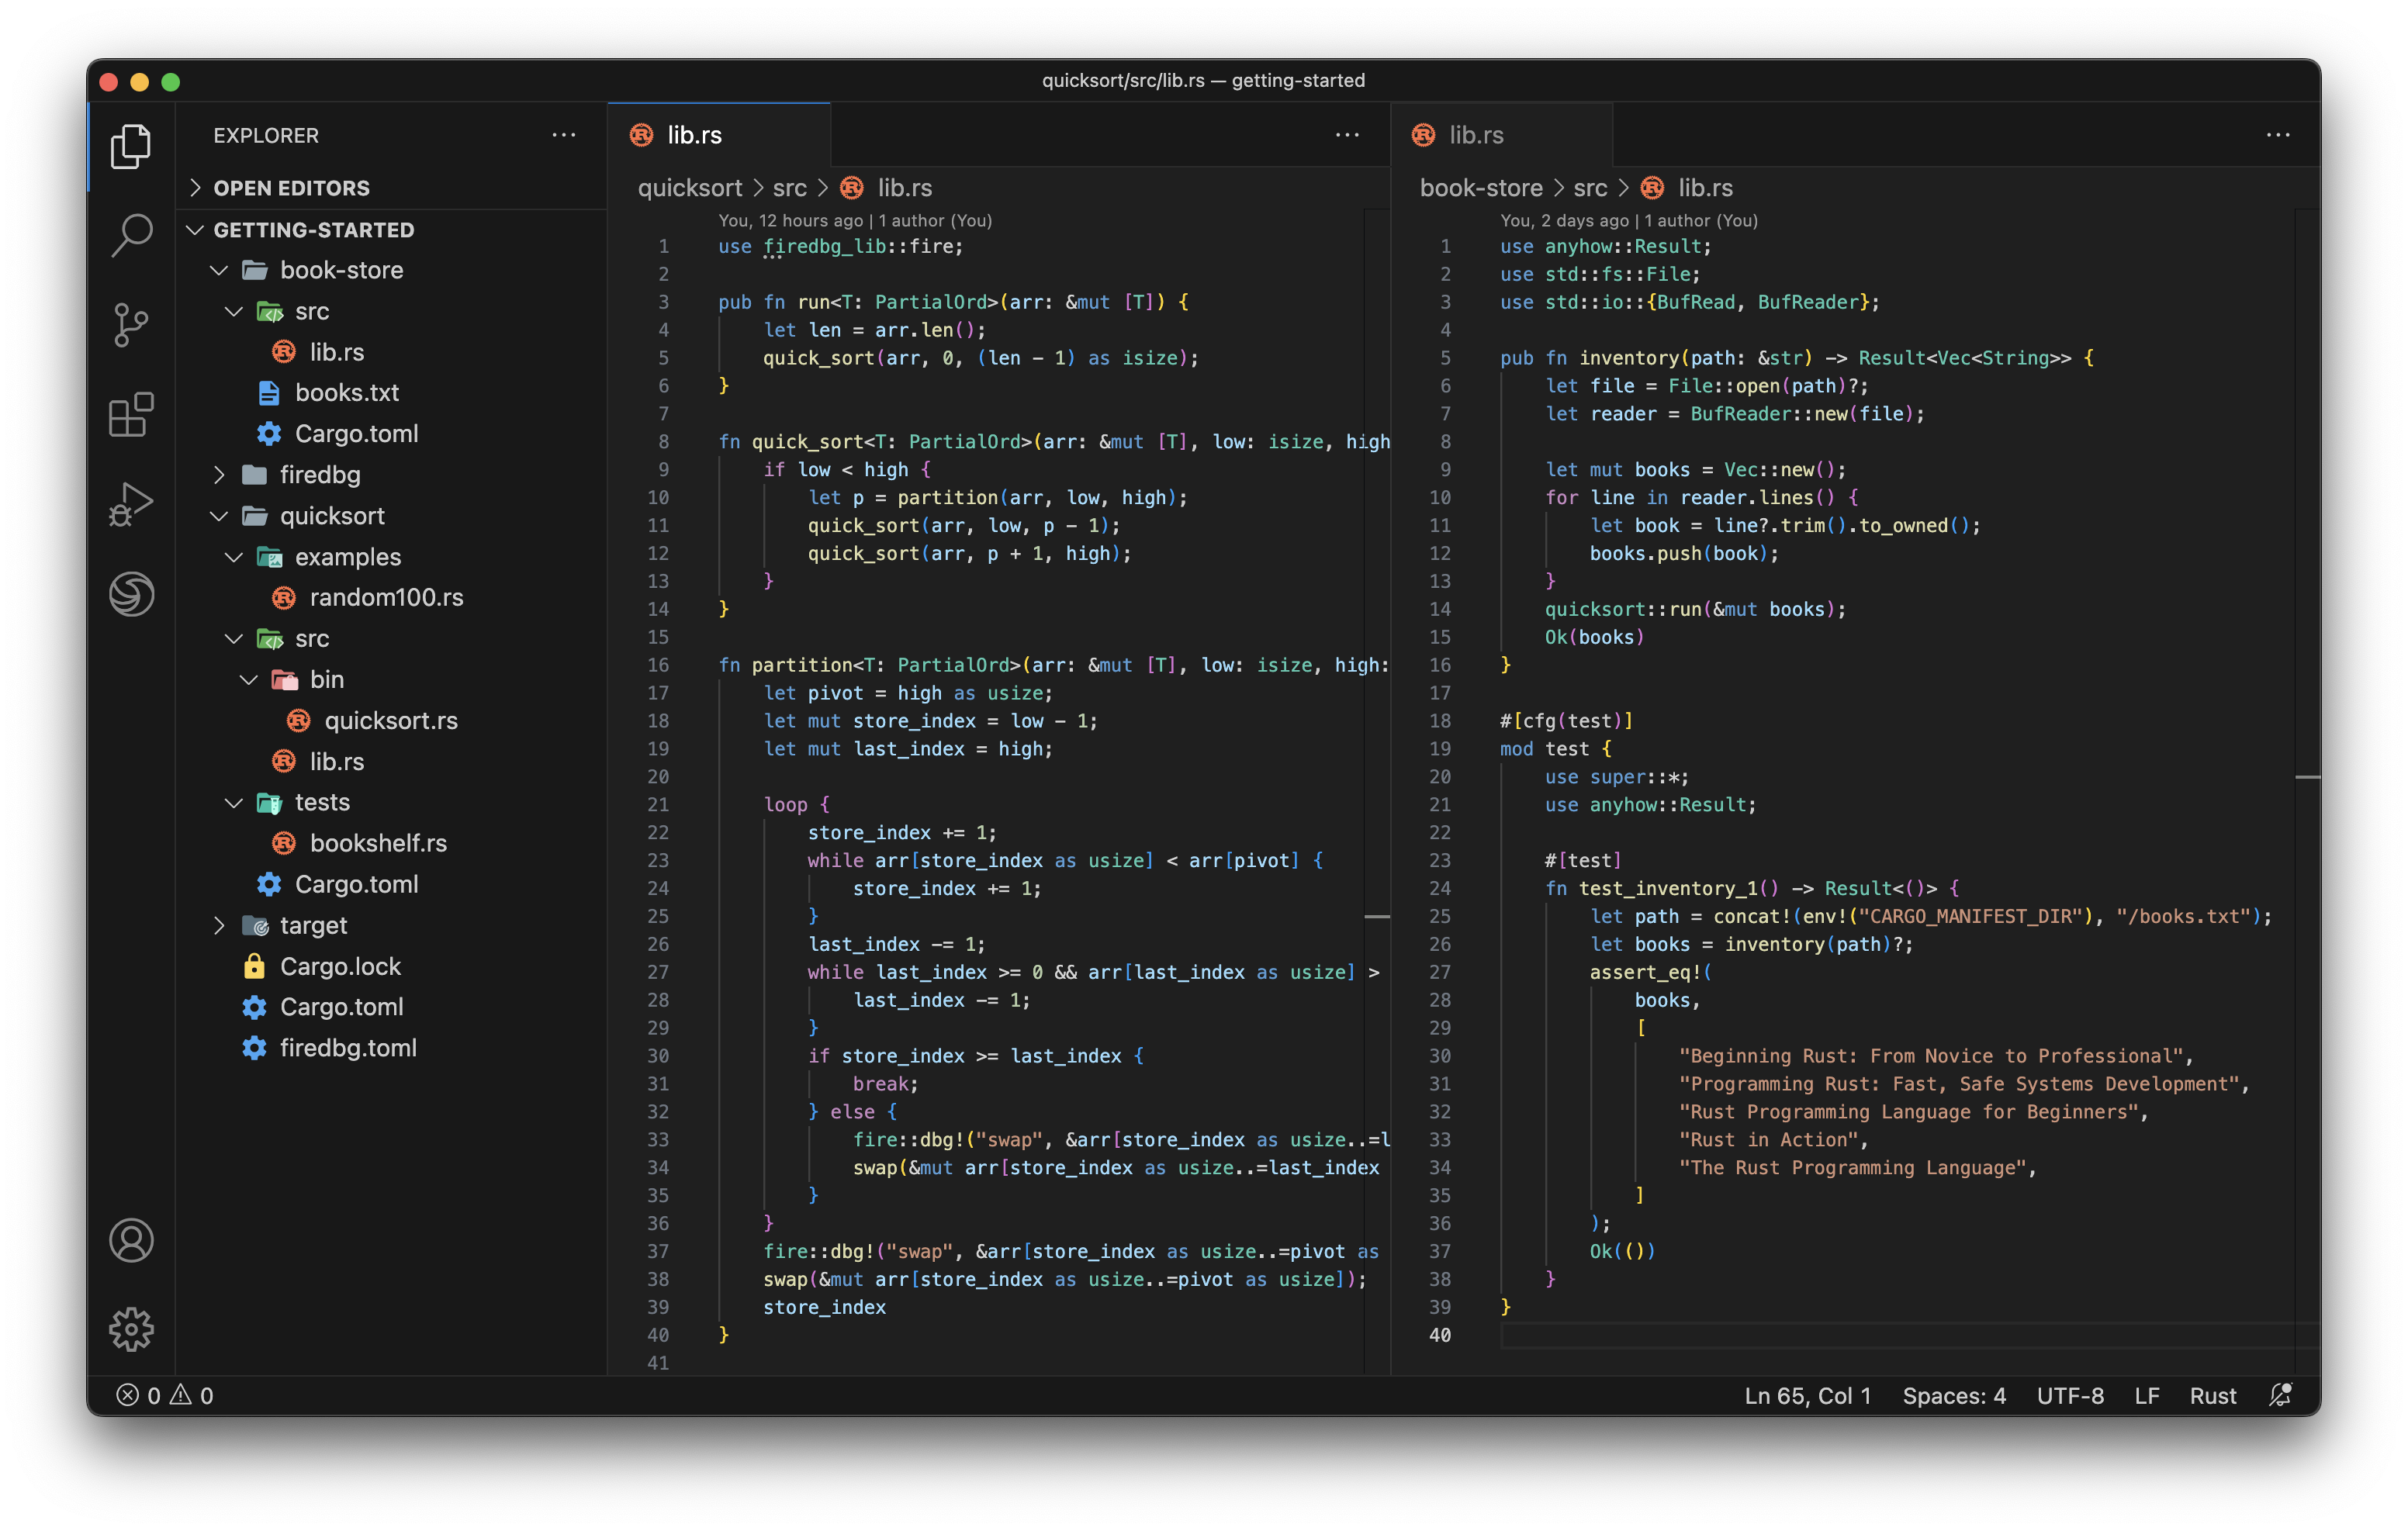
Testbench with full source code
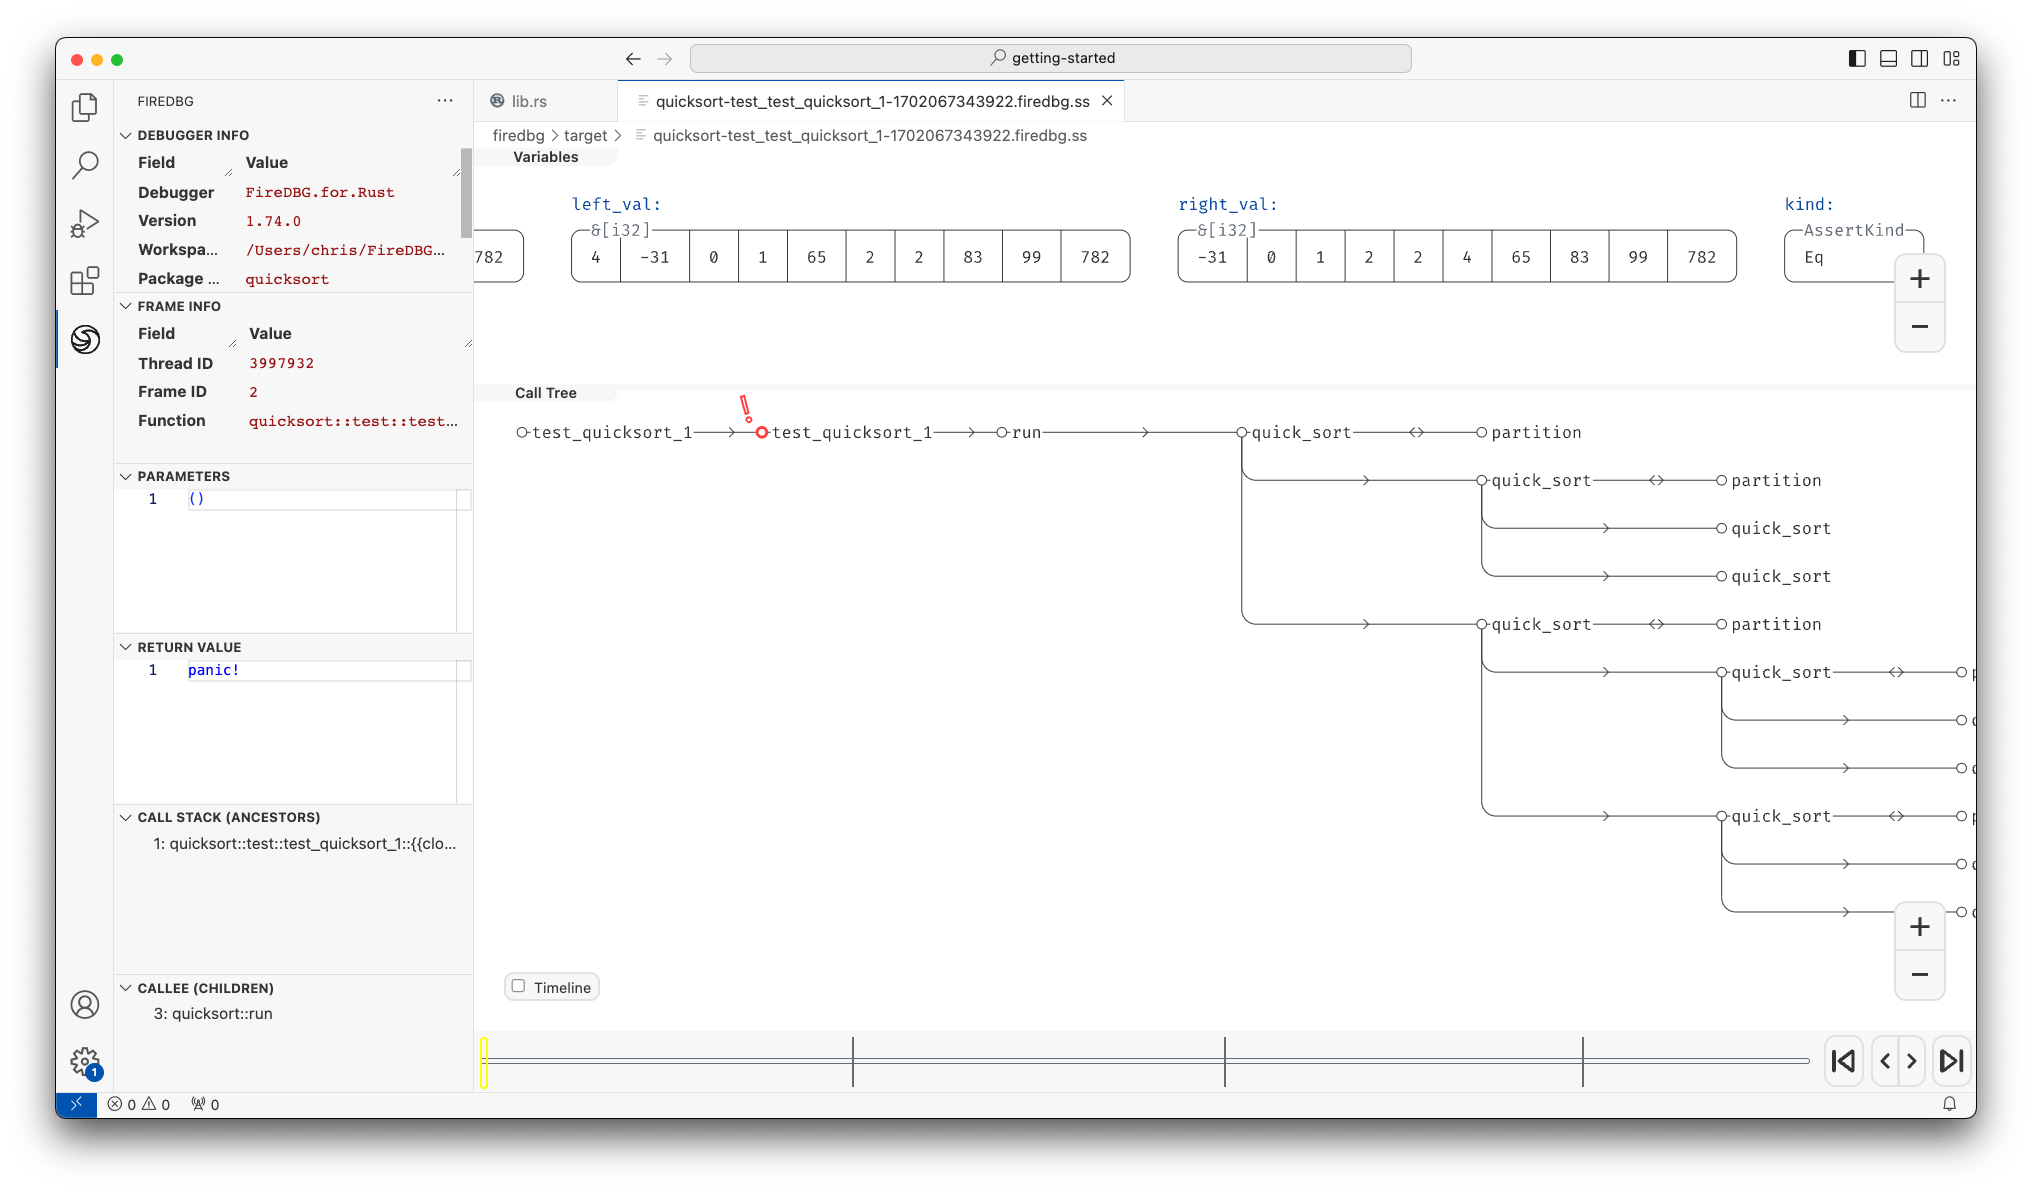
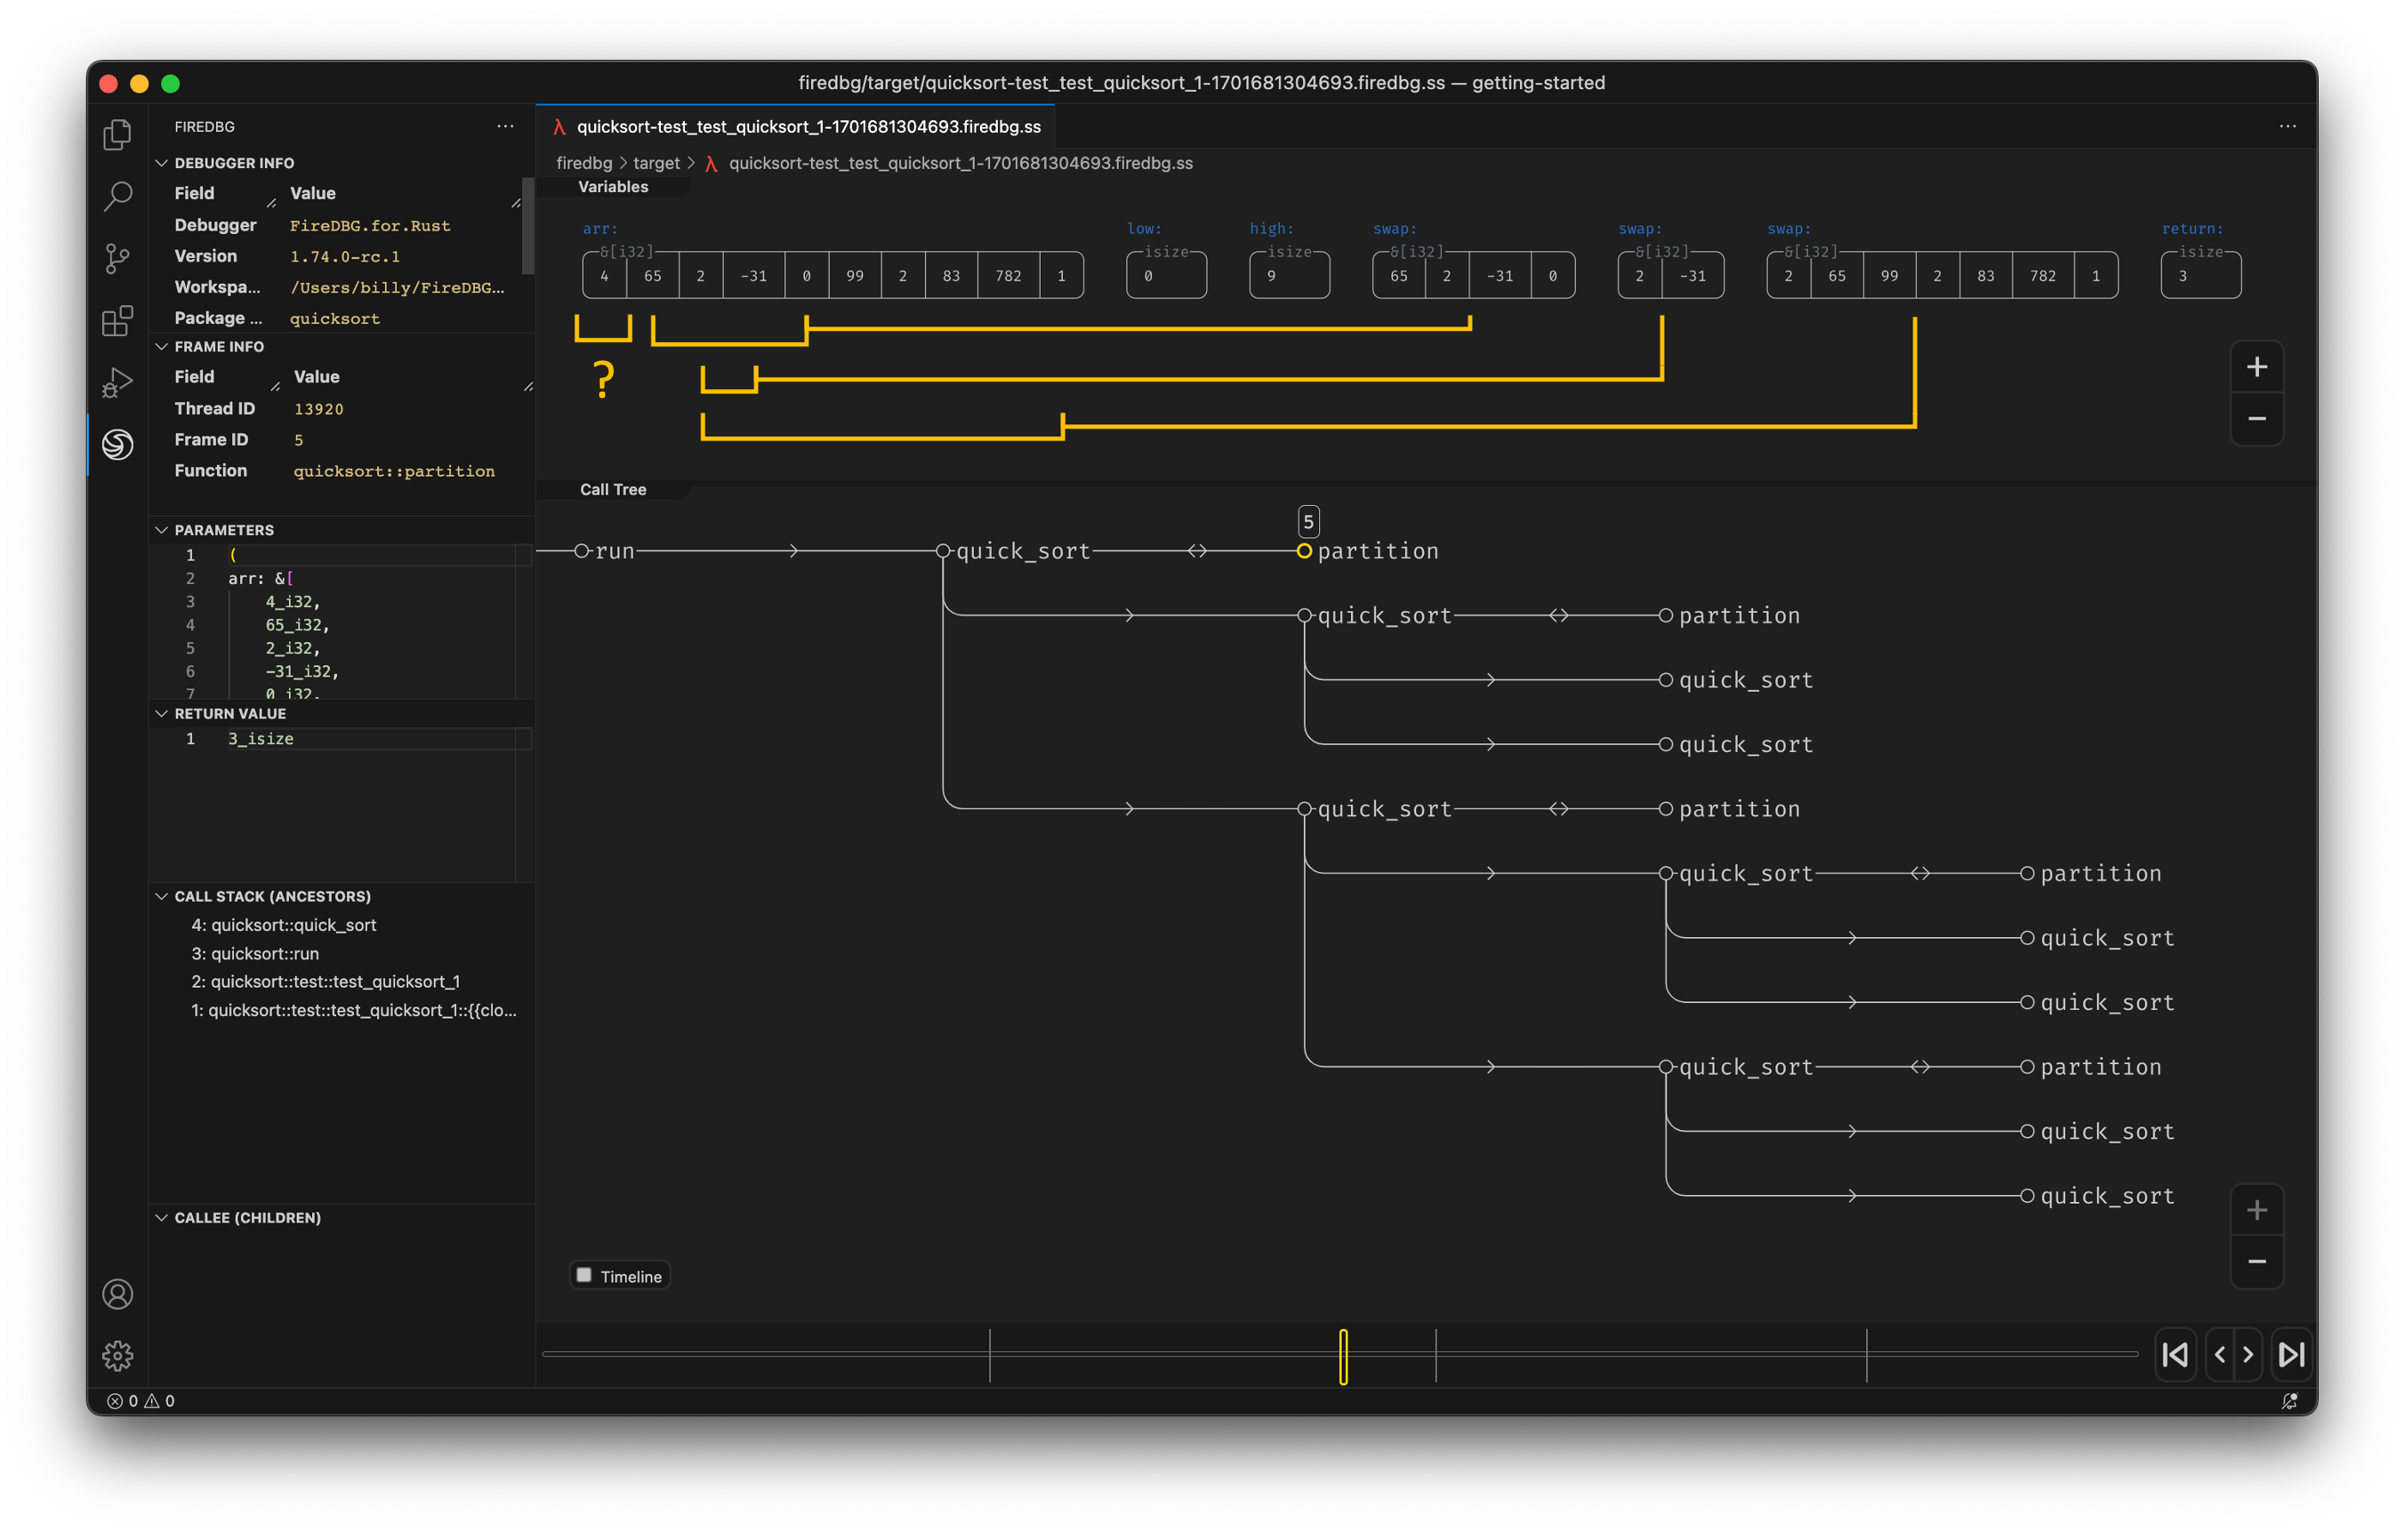
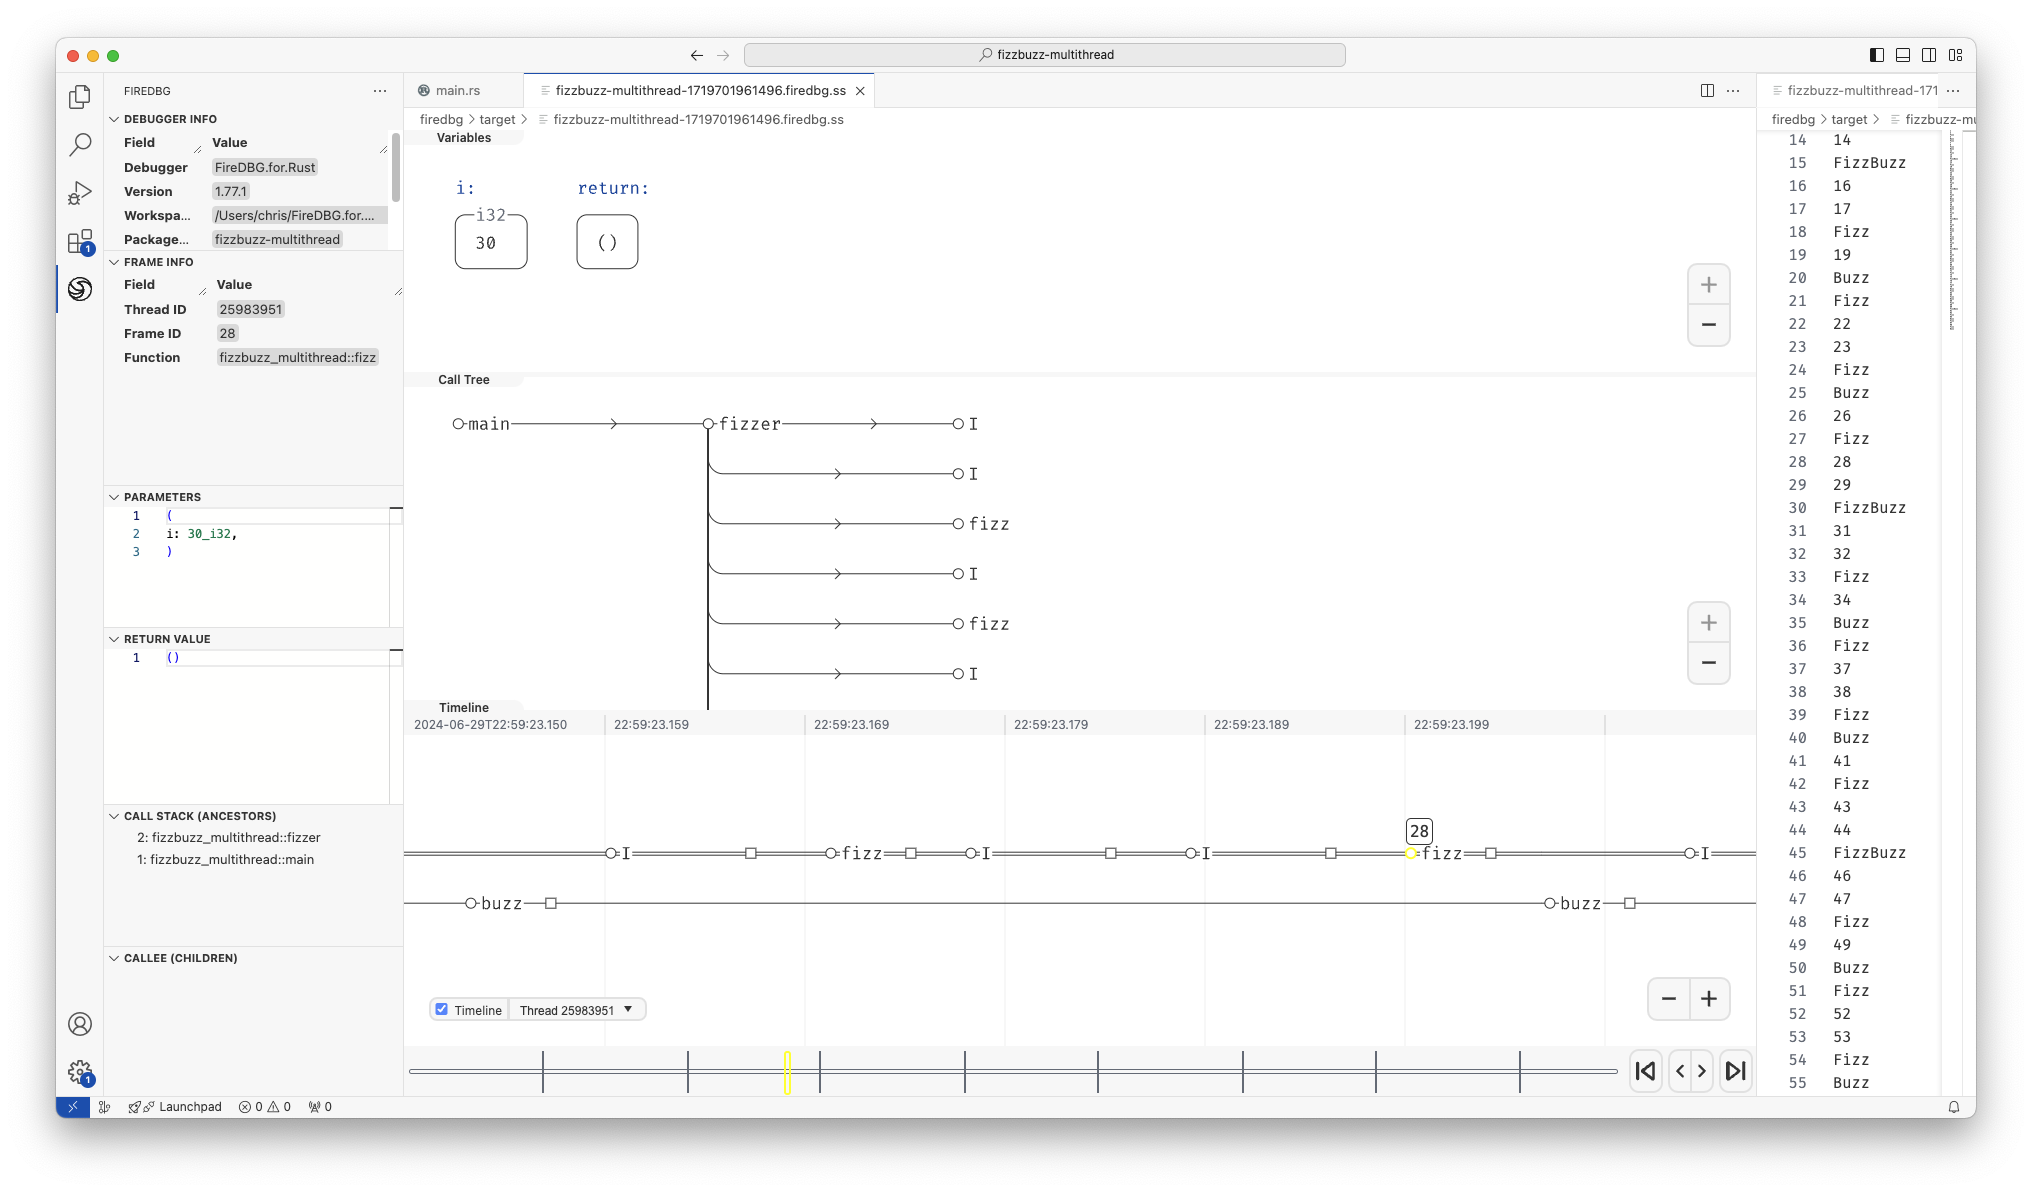
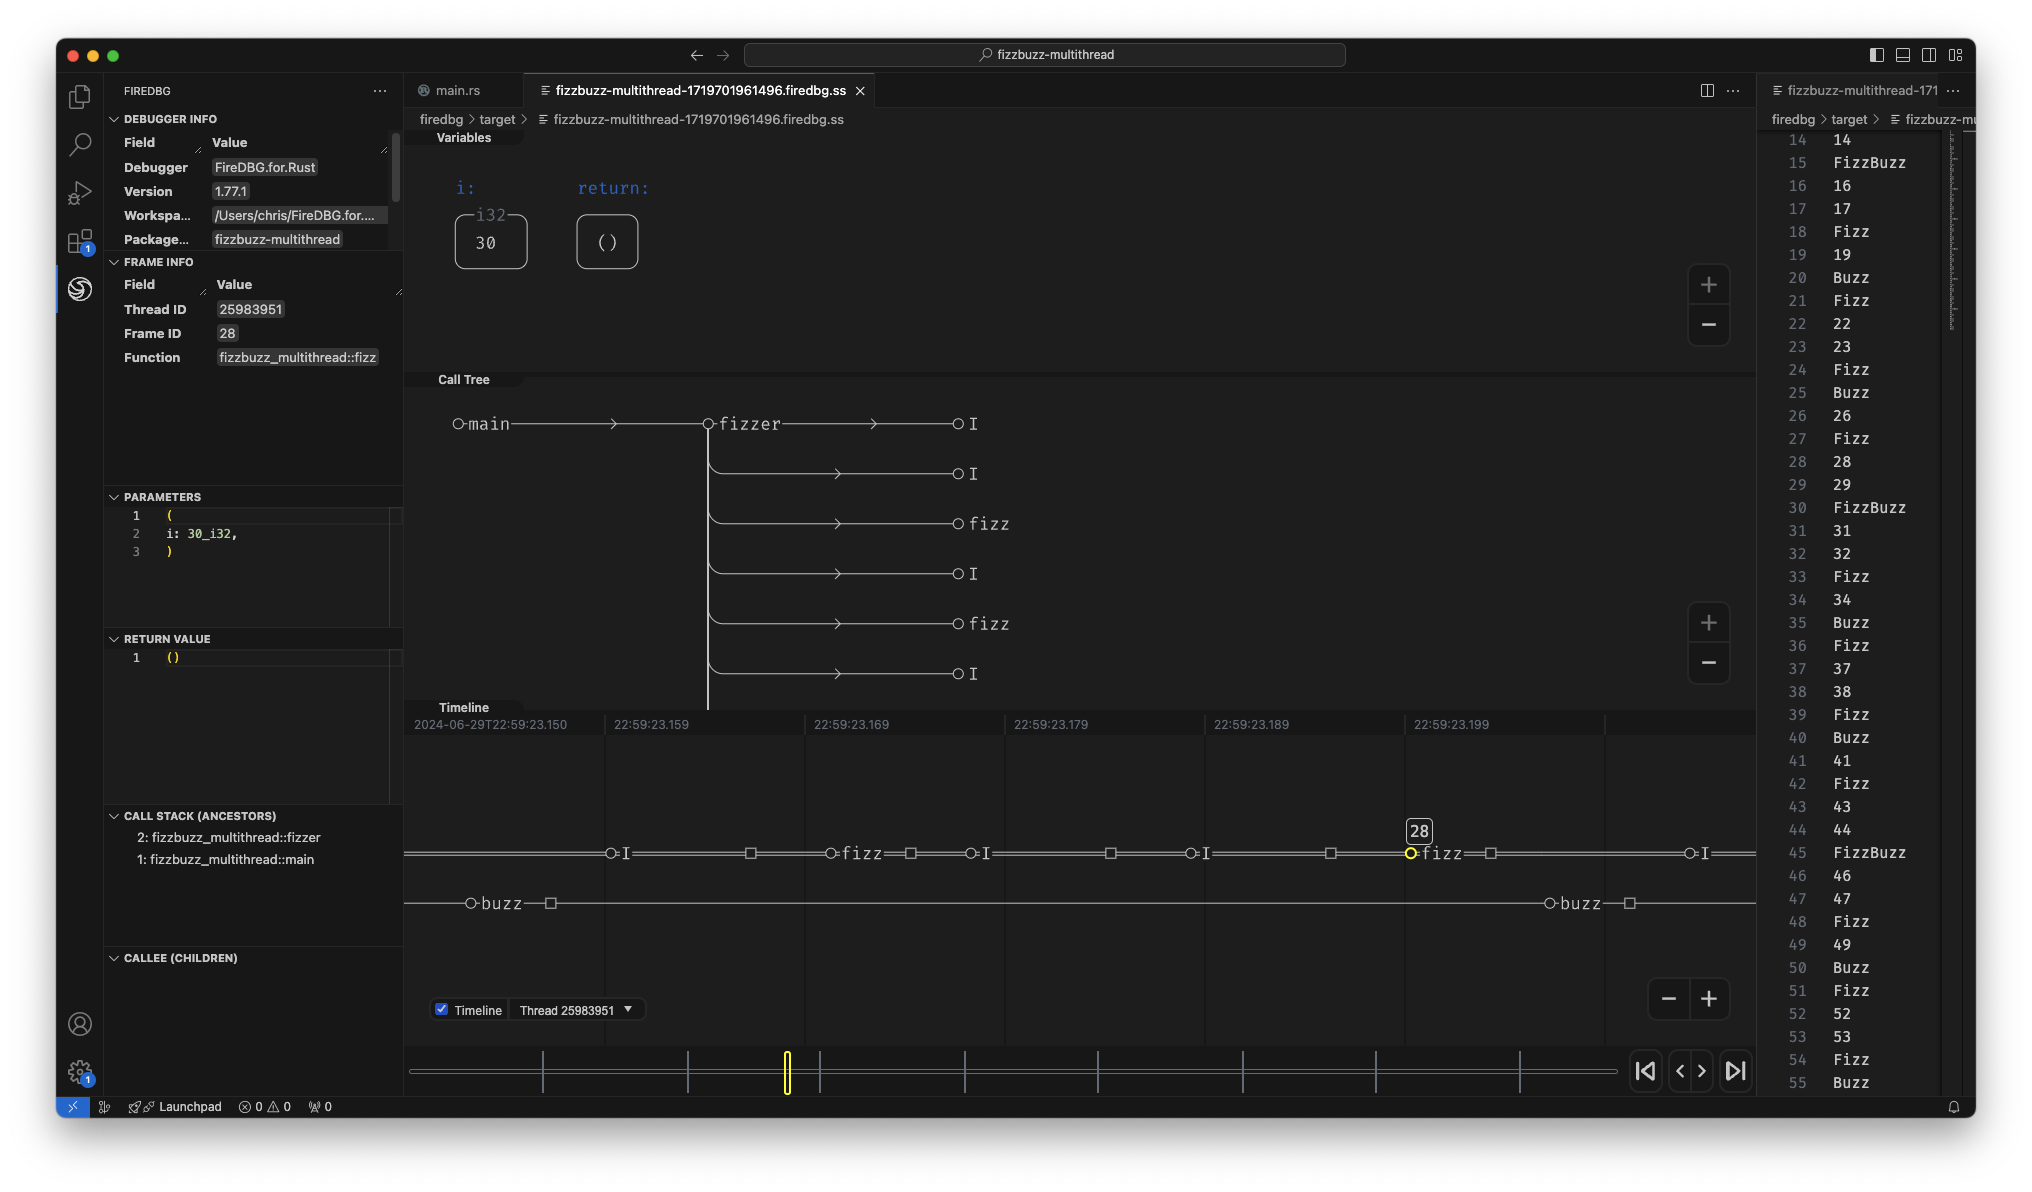
In the above screenshot, we can see a snapshot at the precise moment of i = 30:
- In the "Timeline" panel, there are two threads, the one with double line
==is the main thread, aka Fizz thread. The thread below--is the Buzz thread. - On the timeline,
○denotes function call,□denotes function return. - The first
○-fizz-□from the left is for the number27. The first○-buzz-□is for the number25. - The subsequent two
○-I-□are for28and29respectively. - The second
○-fizz-□is highlighted (frame id28), and the statei = 30is show in the top "Variables" panel. - We can see that the
○-buzz-□on the other thread returns before the main thread continues.
Conclusion
In this article we discussed:
- The basics of multithreaded programming
- The analysis and resolution of race conditions
- Synchronization with zero-sized channels and a double-handshake protocol
- Visualizing multithreaded programs with FireDBG
FireDBG can be used to study parallel algorithms in simulation, before scaling up to real-world distributed systems.
Probably the alternative title for this article can be "Rendezvous channel - the Timedoor between parallel threads".
Rustacean Sticker Pack 🦀
The Rustacean Sticker Pack is the perfect way to express your passion for Rust. Our stickers are made with a premium water-resistant vinyl with a unique matte finish. Stick them on your laptop, notebook, or any gadget to show off your love for Rust!
Moreover, all proceeds contributes directly to the ongoing development of SeaQL projects.
Sticker Pack Contents:
- Logo of SeaQL projects: SeaQL, SeaORM, SeaQuery, Seaography, FireDBG
- Mascot of SeaQL: Terres the Hermit Crab
- Mascot of Rust: Ferris the Crab
- The Rustacean word
Support SeaQL and get a Sticker Pack!